A newer version of this document is available. Customers should click here to go to the newest version.
Identifying Tasks that Operate on Common Input
Intel® oneAPI Threading Building Blocks (oneTBB) adds additional meta information to trace data, such as a frame number that a current task is working on. You can use this metadata to track different pipeline stages in execution, for example to identify an unbalanced pipeline. The following demonstrates how to use the user event tracing interface to enable the Flow Graph Analyzer color-by-data feature.
Highlighted in bold is code that enables the Flow Graph Analyzer to add a unique ID (frame ID) to group tasks.
#include "tbb/flow_graph.h"
#include "tbb/tbb_profiling.h"
#include <string>
#include <vector>
int main() {
  tbb::flow::graph g;
  const int max_frames = 20;
  std::vector<tbb::profiling::event*> e;
  for(int i=0; i<nbr_of_frames;++i)
    e.push_back(new tbb::profiling::event(std::to_string(i)));
  tbb::flow::source_node<int> source( g,
    [&]( int &v) -> bool {
      static int i = 0;
      if( i < max_frames ) {
        e[i]->emit();
        v = i++;
        return true;
      }
      return false;
    }, false);
  tbb::flow::function_node<int> foo( g, tbb::flow::unlimited,
    []( const int &input1) -> int {
      tbb::profiling::event::emit(std::to_string(input1));
      return input1;
    });
  tbb::flow::function_node<int> bar( g, tbb::flow::unlimited,TBB
    []( const int &input1) -> int {
      tbb::profiling::event::emit(std::to_string(input1));
      return input1;
    });
  make_edge(source, foo);
  make_edge(source, bar);
  source.activate();
  g.wait_for_all();
  return 0;
}
Compile the code with the TBB_USE_THREADING_TOOLS macro and link against the tbb library.
To enable the Flow Graph Analyzer color-by-data feature:
Assign IDs to events doing one of the following:
Option 1:
Create an event object or a collection of events upfront, where the only argument is a string (data ID) that identifies the event.
Call the emit function of the object to tag a task with a data ID.
- Option 2: Call a static function inline (inside a task body).
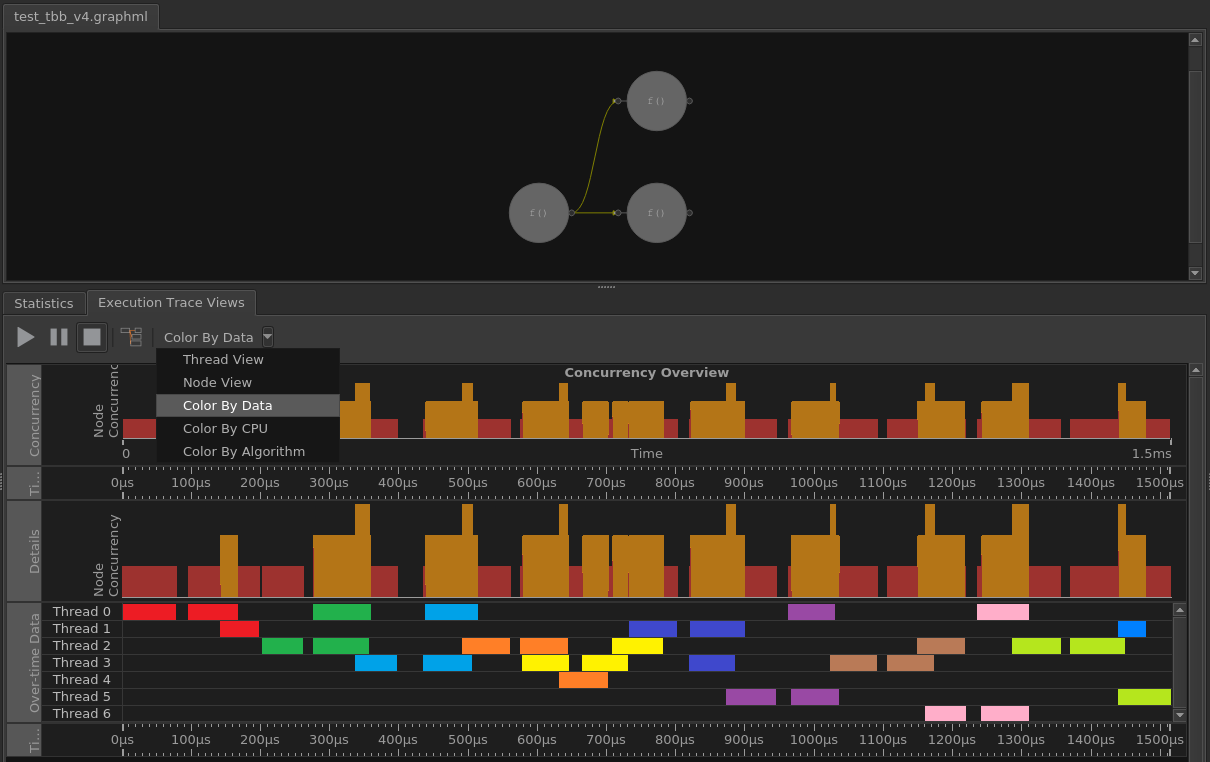
- In the Execution Trace Views tab in the bottom pane, choose Color By Data from the drop-down list.
Result: The Flow Graph Analyzer groups tasks that share the same data ID and displays them in a common color: