A newer version of this document is available. Customers should click here to go to the newest version.
Explore Threading Results
Intel® Advisor provides several ways to work with the Threading results.
View Results in CLI
If you run the Threading perspective from command line, you can print the results collected in the CLI and save them to a .txt, .csv, or .xml file.
For example, to generate the Suitability report for the OpenMP* threading model:
advisor --report=suitability --project-dir=./advi_results --threading-model=openmpYou should see a similar result:
Target CPU Count: 8     Threading Model: OpenMP*
Maximum gain for all sites: 6.10998

All Sites
Site Label      Source Location       Impact to    Total Serial Time   Total Parallel Time   Site Gain   Average Serial Time ...
                                      Program Gain                                                                           ...
_____________________________________________________________________________________________________________________________...
     solve   nqueens_serial.cpp:154          6.11x            4.080s                0.631s       6.47x                4.080s ...


Site Details
Annotation     Annotation Label      Source Location       Number of Instances   Maximum Instance   Average Serial           ...
                                                                                 Time               Time                     ...
_____________________________________________________________________________________________________________________________...
Selected Site             solve   nqueens_serial.cpp:154                     1             4.080s           4.080s           ...
         Task          setQueen   nqueens_serial.cpp:156                    14             0.477s           0.267s           ...
         Lock                                           ?                365596            < 0.001s         < 0.001s         ...


Site Options
                                         Benefit   Loss If
Site            Option           Done?   If Done   Not Done   Recommended
_________________________________________________________________________
solve     Reduce Site Overhead                                      No
solve     Reduce Task Overhead                                      No
solve     Reduce Lock Overhead                                      No
solve   Reduce Lock Contention             0.16x                    No
solve     Enable Task Chunking                                      No
The result is also saved into a text file advisor-suitability.txt located at ./advi_results/e<NNN>/st<NNN>.
You can generate a report for any analysis you run. The generic report command looks as follows:
advisor --report=<analysis-type> --project-dir=<project-dir> --format=<format>
where:
<analysis-type> is the analysis you want to generate the results for. For example, survey for the Survey report, suitability for the Suitability report, or dependencies for the Dependencies report.
--format=<format> is a file format to save the results to. <format> is text (default), csv, xml.
If you generate the Suitability report, you can use additional options to control the result view:
--target-system=[cpu | xeon-phi | offload-to-xeon-phi] is a platform to model parallelization on.
--threading-model=[tbb | cilk | openmp | tpl | other] is a threading model to use.
--reduce-site-overhead=<string> is a list of annotated loops/functions to check if you can reduce overhead.
You can also generate a report with the data from all analyses run and save it to a CSV file with the --report=joined action as follows:
advisor --report=joined --report-output=<path-to-csv>
where --report-output=<path-to-csv> is a path and a name for a .csv file to save the report to. For example, /home/report.csv. This option is required to generate a joined report.
See advisor Command Option Reference for more options.
View Results in GUI
If you run the Threading perspective from command line, a project is created automatically in the directory specified with --project-dir. All the collected results and analysis configurations are stored in the .advixeproj project, that you can view in the Intel Advisor.
To open the project in GUI, you can run the following command:
advisor-gui <project-dir>
If you run the Threading perspective from GUI, the result is opened automatically after the collection finishes.
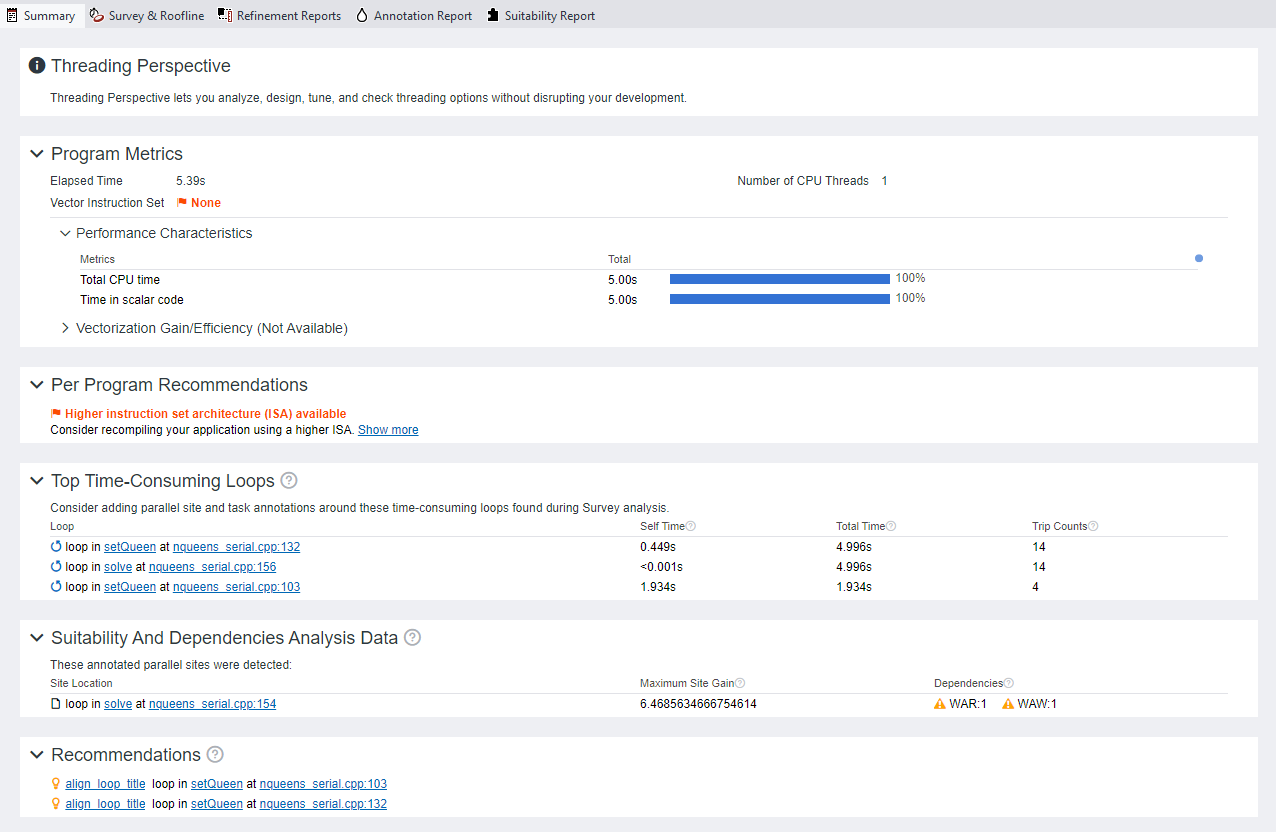
You first see a Summary report that includes the overall information about loops/functions performance in your code and the annotated parallel sites:
Performance metrics of your program and top five time-consuming loops/functions
Optimization recommendations for the whole application
Estimated performance gain for annotated loops/functions when parallelized
Save a Read-only Snapshot
A snapshot is a read-only copy of a project result, which you can view at any time using the Intel Advisor GUI. You can save a snapshot for a project using Intel Advisor GUI or CLI.
To save an active project result as a read-only snapshot from GUI: Click the  button in the top ribbon of the report. In the Create a Result Snapshot dialog box, enter the snapshot details and save it.
To save an active project result as a read-only snapshot from CLI:
advisor --snapshot --project-dir=<project-dir> [--cache-sources] [--cache-binaries] -- <snapshot-path>
where:
- --cache-sources is an option to add application source code to the snapshot.
- --cache-binaries is an option to add application binaries to the snapshot.
- <snapshot-path is a path and a name for the snapshot. For example, if you specify /tmp/new_snapshot, a snapshot is saved in a tmp directory as new_snapshot.advixeexpz. You can skip this and save the snapshot to a current directory as snapshotXXX.advixeexpz.
To open the result snapshot in the Intel Advisor GUI, you can run the following command:
advisor-gui <snapshot-path>
You can visually compare the saved snapshot against the current active result or other snapshot results.
See Create a Read-only Result Snapshot for details.
Result Interpretation
When you run the Threading perspective from GUI, you can examine the results and try different threading designs: