A newer version of this document is available. Customers should click here to go to the newest version.
performance_analysis Samples
Forward Substitution with Trace
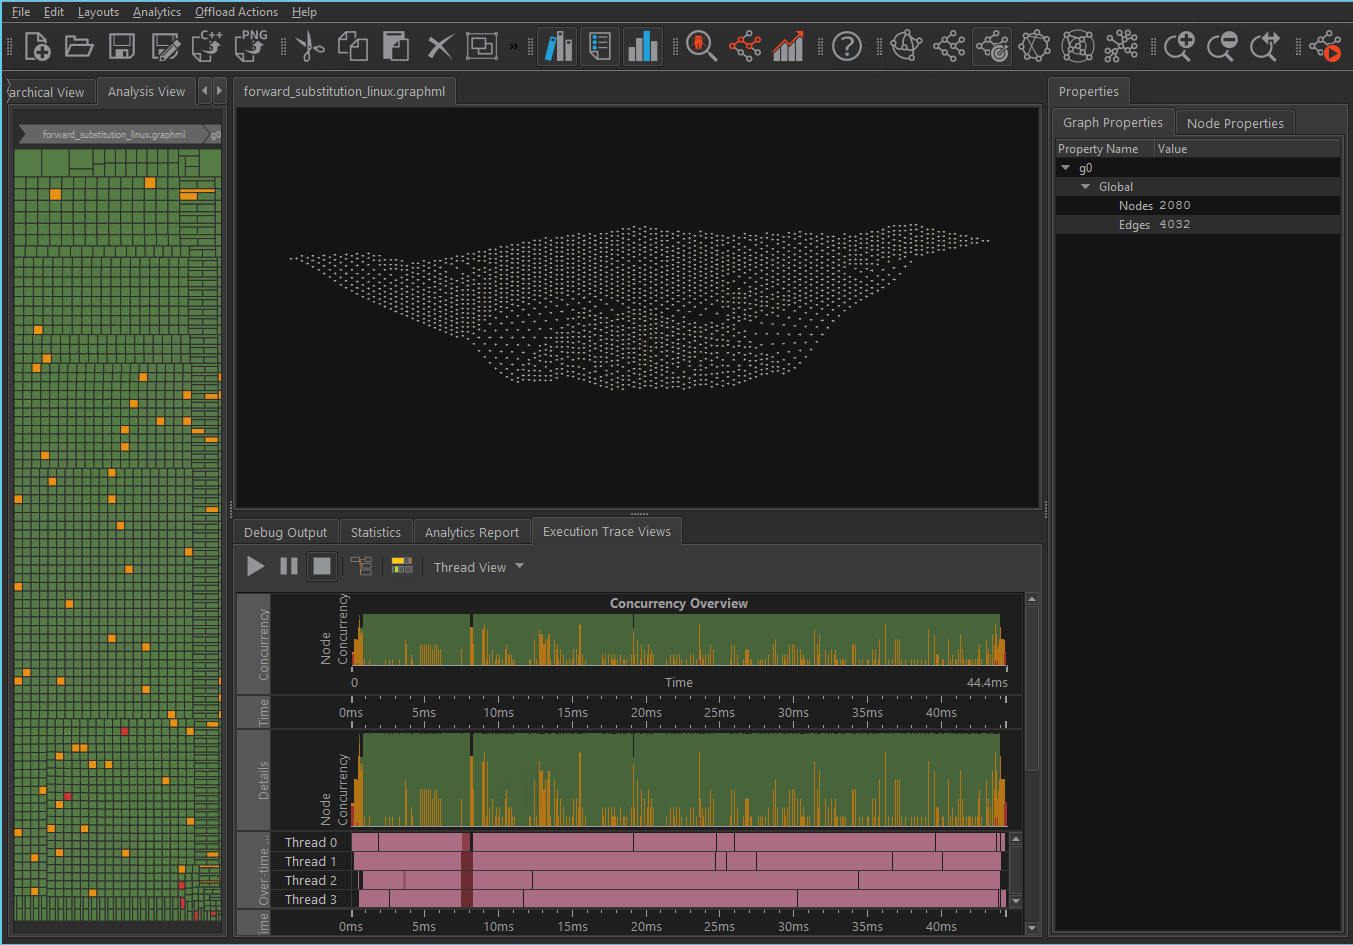
The forward_substitution.graphml sample shows the topology and behavior of a Intel® oneAPI Threading Building Blocks (oneTBB) flow graph application that provides an implementation of forward substitution on a lower-triangular matrix. The trace is for a single execution of the graph, using 4 threads for a 8192x8192 matrix with a block size of 128. The runtime trace of the application is contained in the matching forward_substitution.traceml file. This matching file is loaded automatically by the Flow Graph Analyzer.

Feature Detection with Trace
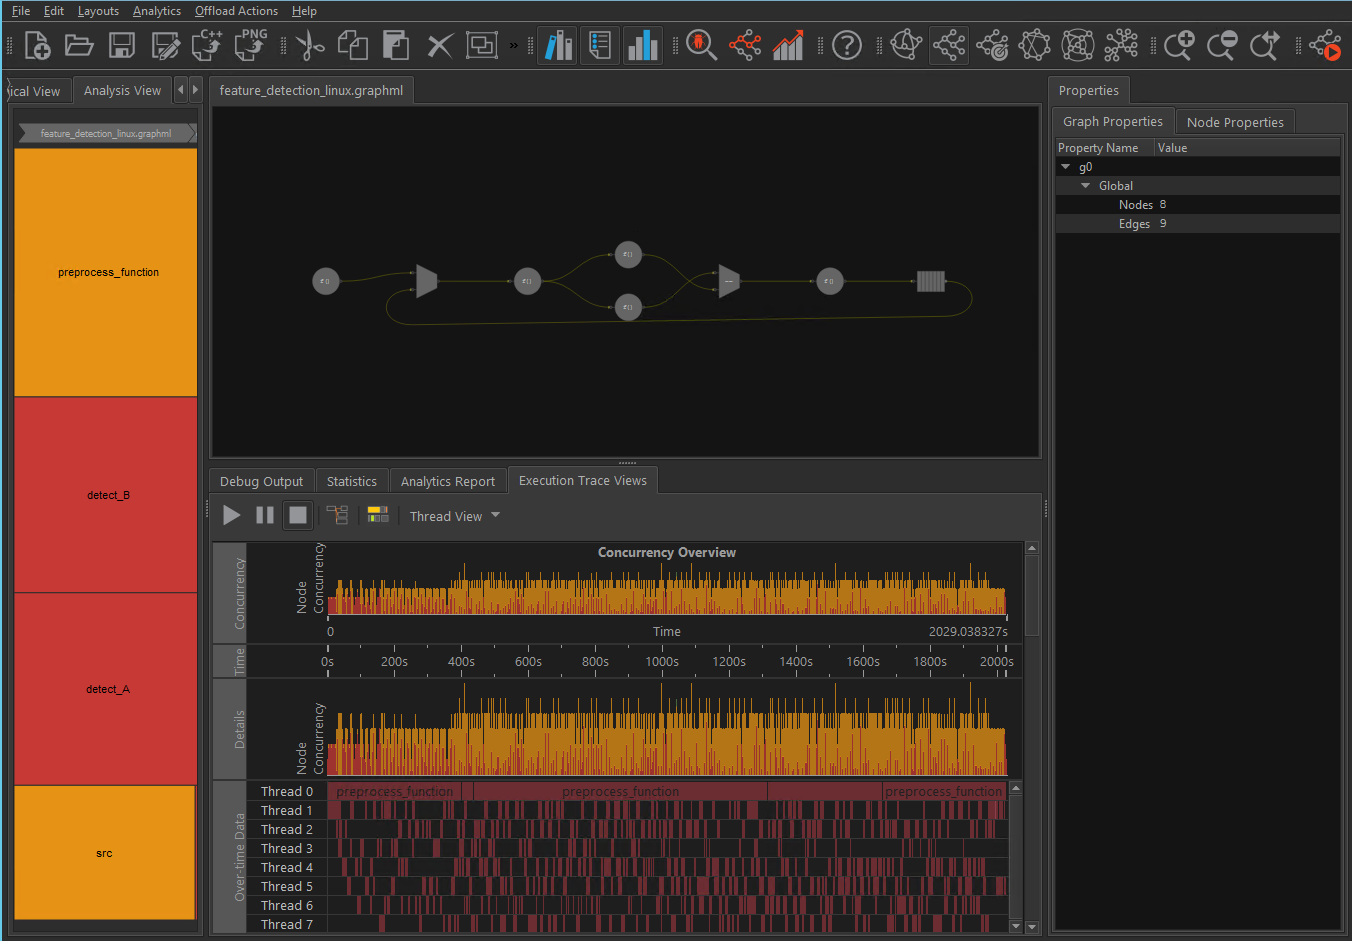
The feature_detection.graphml sample shows the topology and behavior of a oneTBB flow graph application.
This trace was collected using 8 threads and 32 buffers provided to the buffer queue. The concurrency varies over time, but is limited to 8 threads at most.

Computer Vision with Trace
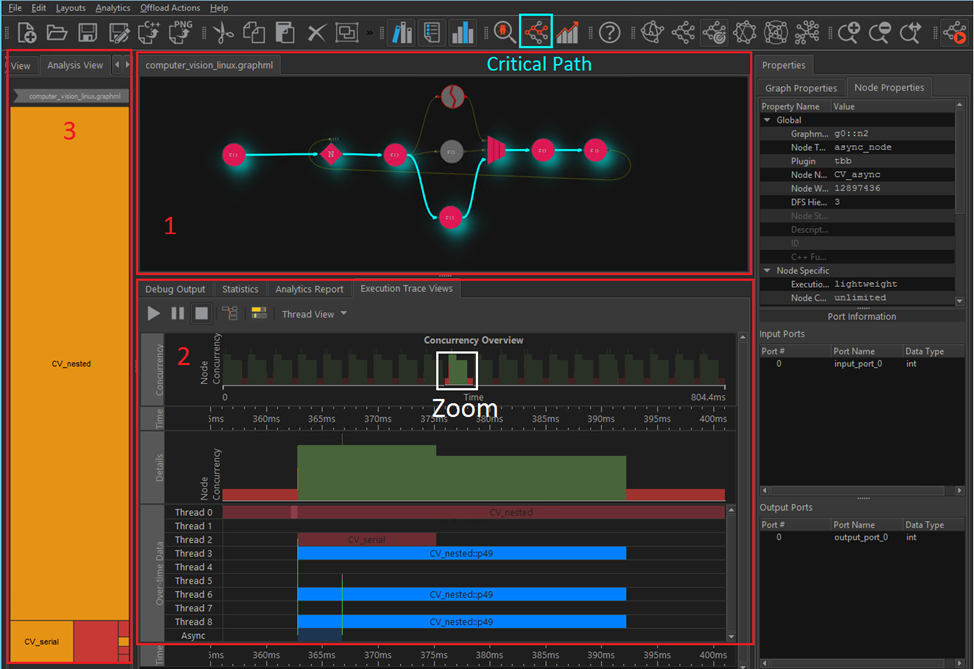
The computer_vision.graphml sample shows the topology and behavior of a oneTBB flow graph application that represents a classic example of data flow parallelism. It is composed of three different computer vision (CV) algorithms that process the same input data. The data is a video input stream, and you can observe a resulting regular pattern in the timeline chart (the trace contains around 20 frames).
Notice the following:

Red outlined area #1 |
You can use the critical path calculation functionality (turquoise box) to identify bottlenecks in the data flow. As a result of this feature, all nodes on the critical path are highlighted. |
White box in the #2 area |
Zoom in the timeline to analyze a single frame execution in detail. The frame execution flow is the following:
|
Lower part of red outlined area #2 |
For a oneTBB flow graph, an external activity can be encapsulated in a predefined async node. This activity represents offloading work to an Accelerator (for example, FPGA, GPU). The beginning and end of this activity are displayed as green vertical lines in the timeline. You can find a single execution within a single frame for each CV algorithm (represented by the nodes CV serial, CV nested, CV async). CV nested represents a node with a nested oneTBB parallel for algorithm that consumes most of the CPU time on average. |
Red outlined area #3 |
The Treemap shows the average node weight. CV_nested includes a oneTBBparallel_for algorithm and consumes most of the CPU time. |