3.2.7.3.2. Stack Overflow
- Check the current value of the stack pointer
- Compare this to the max stack size, which is stored in the Exception Temp (ET) Register
Example of function with stack checking code
    ___vfprintf_internal_r:
000002ec:   addi sp,sp,-1308
000002f0:   bgeu sp,et,0x2f8 <___vfprintf_internal_r+12>
000002f4:   break 3
The bgeu and break 3 lines are what is added for the stack overflow checking. If the stack pointer has grown beyond its limits the break is called.
Recognizing and Debugging a Stack Overflow
When a stack overflow occurs, having registered an instruction-related exception handler helps you identify it by its behavior.
Default Instruction-Related Exception Handler
The default value for an instruction-related exception handler is when it is not registered.
How to Isolate the Cause of a Sigtrap
The Debugger breaks with sigtrap:
- Use the thread view in the debug window and select the last state.
This is the highest number. The last thread is the actual call than overflowed.
- Switch to instruction stepping mode in the debugger by pressing the i-> button in the debug window, which opens the memory disassembly view.
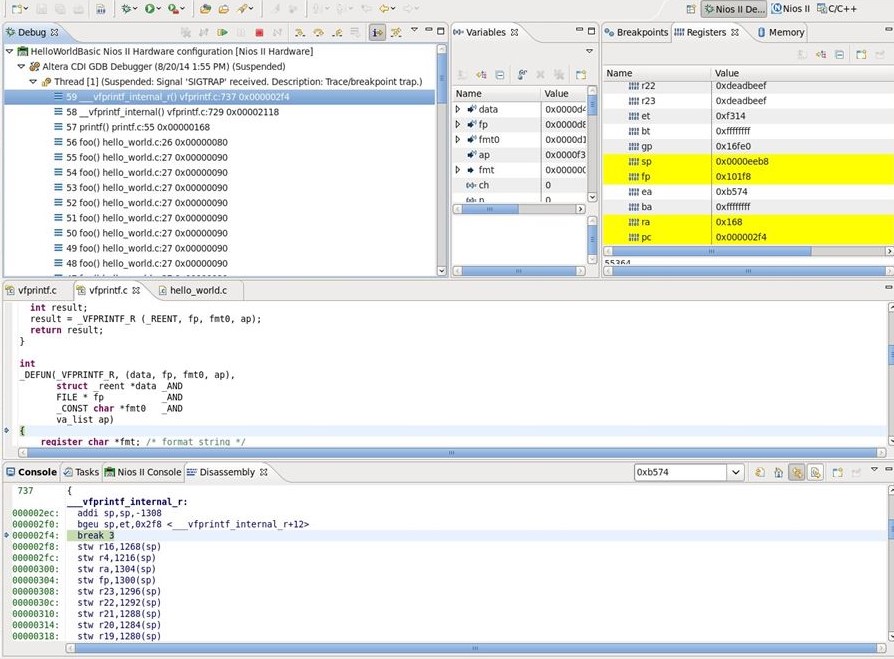
If there has been a stack overflow the disassembly view should show execution pointing to a break3 after the stack check:
___vfprintf_internal_r: 000002ec: addi sp,sp,-1308 000002f0: bgeu sp,et,0x2f8 <___vfprintf_internal_r+12> 000002f4: break 3 - Check the value of sp and et which holds the max stack side in the Nios® II register view.
- Move to the prior state in the debug window and re-check sp vs et.
Figure 2. Nios® II Debug window
Custom Instruction-Related Exception Handler
For use outside the debugger, you can register your own instruction-related exception handler which is called when the break (or any exception) is seen.
On an exception, including overflow, the HAL calls the instruction-related exception handler, passing in the cause field from the exception register, and the address which caused the exception. At this point, it is up to you to decide what do.
For more information about how to register an instruction-related exception, refer to