A newer version of this document is available. Customers should click here to go to the newest version.
2.1.1. Constructing Communication Links in the Link Designer Module
2.1.2. Link and Simulation Setting
2.1.3. Transmitter Setting
2.1.4. Receiver Setting
2.1.5. IBIS-AMI Wrapper
2.1.6. Channel Setting
2.1.7. Batch Channel Simulation Configuration
2.1.8. Crosstalk Aggressor Transmitter Setting
2.1.9. Repeater and Retimer Configurations
2.1.10. Noise Source Link Component
2.1.11. System Options
2.1.12. Project Management Functions
2.1.13. Archiving and Unarchiving Projects
2.1.14. Device Model Importer
2.1.15. Analysis Functions and Pre-Simulation and Pre-Analysis Checklists
2.1.16. COM Analysis
2.3.3.3. Options
In this panel, you can manage the Channel Viewer’s projects and settings.
- Load: Loads previously saved Channel Viewer settings (including the channel list).
- Save and Save as: Saves the current Channel Viewer configurations and channel list.
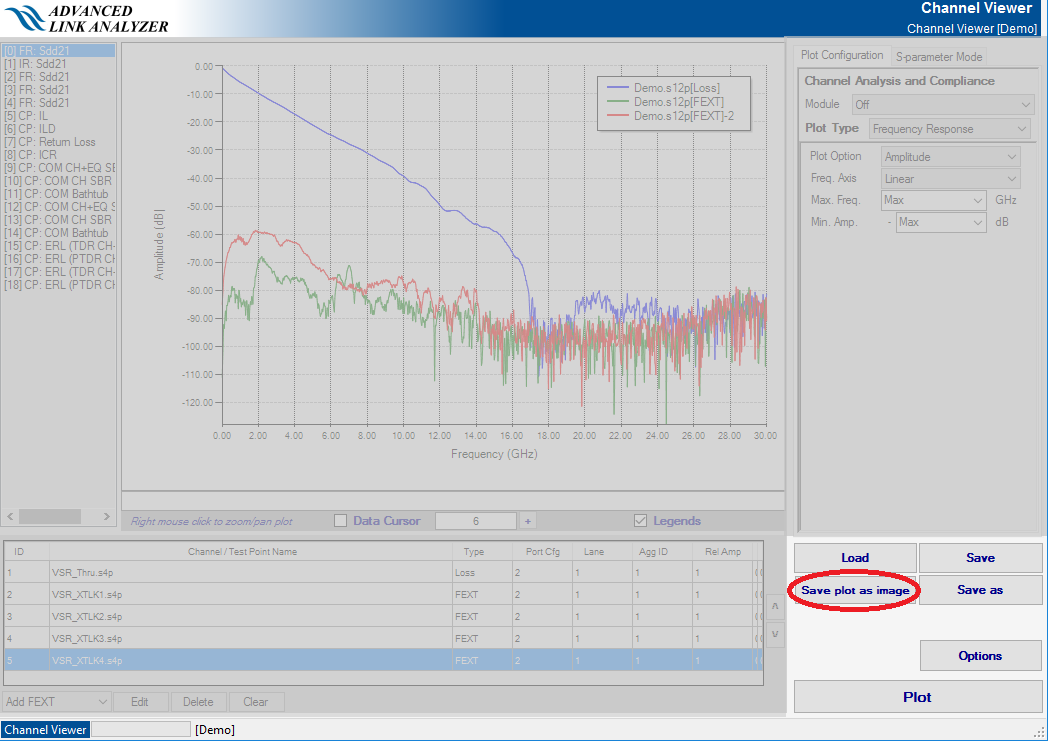
- Save plot as image: Saves the current plot as an image file.
- Options: Opens the Channel Viewer’s Options window. The Options window is described below.
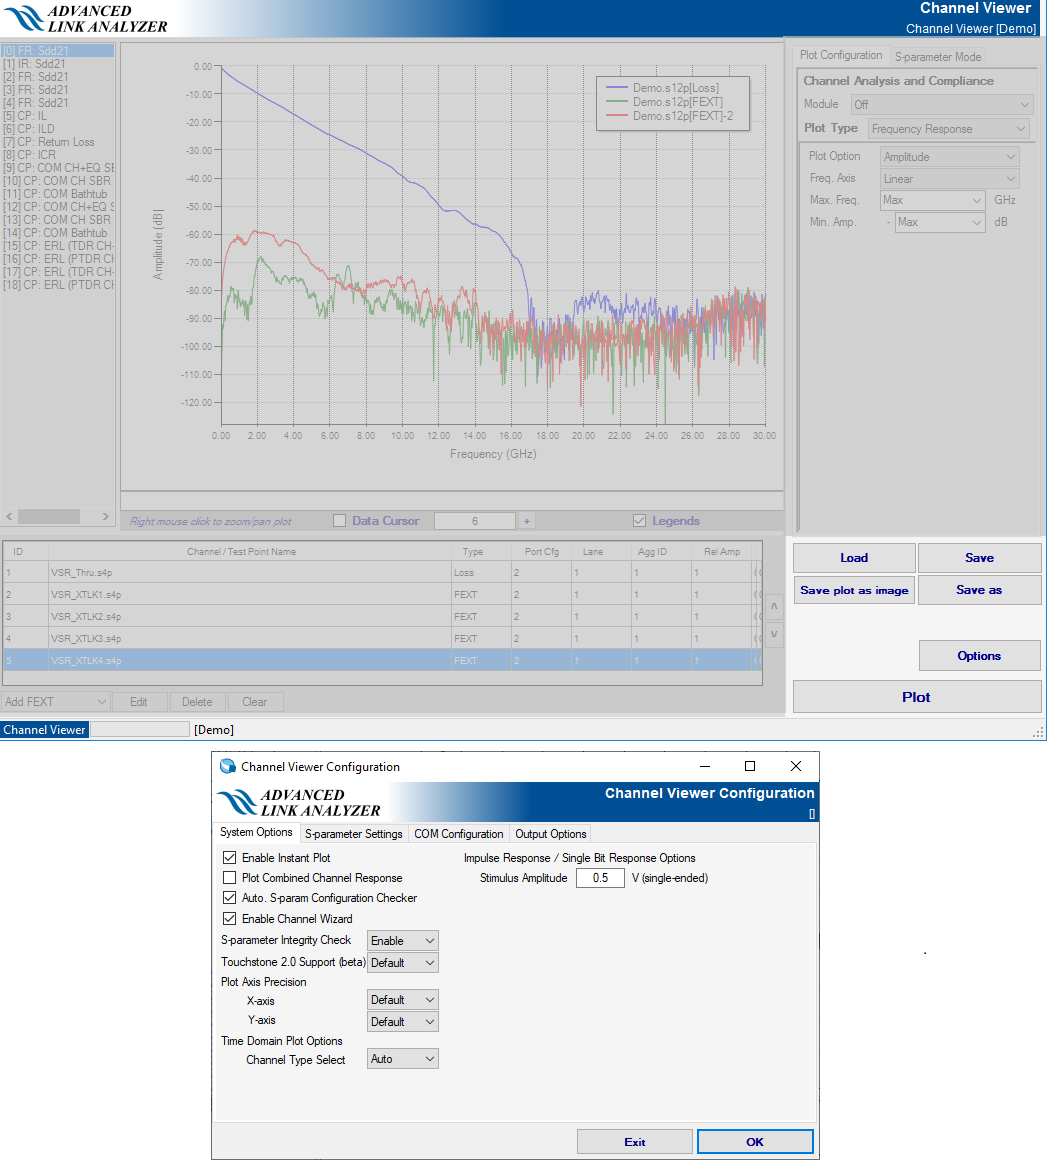
Figure 166. Systems Options


Use this panel to select the following plot options:
- Enable Instant Plot—Enable and disable instant channel plotting when a new channel is added to the channel list. When you disable this option, you must click Plot to plot the channel response.
- Plot Combined Channel Response—When you enable this option, the Channel Observer cascades the channels with Loss type and plots it along with other channel characteristics. The crosstalk channels (NEXT and FEXT) are not cascaded.
- Auto. S-parameter Configuration Checker (ASCC)—Enable and disable the ASCC function. The Channel Viewer uses the ASCC function to determine the port configuration of S-parameters. When you disable ASCC, you must manually select the port configuration of each S-parameter channel model.
- Enable Channel Wizard—If checked, when you select a channel file, Channel Wizard helps configure the channel configuration. If unchecked, you must manually configure the channel configuration.
- S-parameter Integrity Check—If enabled, Channel Wizard checks the channel integrity (the passivity and causality). If Advanced Link Analyzer has problems with opening or accessing an S-parameter, you can disable the S-parameter Integrity Check.
- Touchstone 2.0 Support—Enable or disable Touchstone 2.0 S-parameter file support.
- Plot Axis Precision—You can set the number of decimal points in the x- and y-axis of all plots.
- Time Domain Plot—Channel Views can automatically choose the common channel characteristics for time-domain analysis. For example, when Auto is selected, Channel Viewer chooses Sdd21 for impulse response, single bit response, and step response plots, and chooses Sdd11 for the TDR plot. If Auto Skip is selected, Channel Viewer chooses the likely matched channel types (if you selected any) for time domain analysis. For example, if you choose Sdd11, Sdd12, Sdd21, and Sdd22 and want to plot single bit responses, Sdd12 and Sdd21 are used for the plots, and Sdd11 and Sdd22 are skipped. When "Plot as is" is selected, Channel Viewer plots all time domain results for all selected S-parameter items.
- Impulse Response / Single Bit Response Options—You can specify stimulus amplitude for impulse response and single-bit response calculations. The default value is 0.5 V (single-ended).
Figure 167. Save Plot as Image


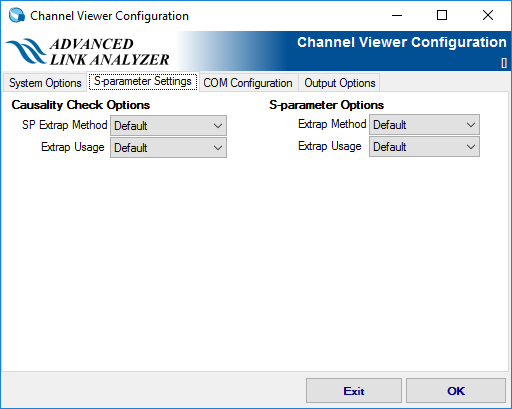
Figure 168. Output Options Configuration Panel


Use this panel to select the following configuration options:
- S-parameter Options
- Extrap Method
- Default—Linear extrapolation.
- IL Fitting Extrapolation—Extrapolation is done by the insertion loss fitting method.
- Extrap Usage—This menu selects the method used in the extrapolation S-parameter channel model.
- Default—The S-parameter is extrapolated but is capped at the final amplitude value.
- Always Apply—The S-parameter is extrapolated without restriction.
- Extrap Method
- Causality Check Options
- SP Extrap Method—This menu selects the S-parameter extrapolation method.
- Default—Insertion loss fitting extrapolation method.
- Last Amplitude Value—Linear extrapolation capped by the last amplitude value.
- Extrap Usage—This menu selects the method used in the extrapolation S-parameter channel model. This entry only applies during S-parameter causality checking.
- SP Extrap Method—This menu selects the S-parameter extrapolation method.