A newer version of this document is available. Customers should click here to go to the newest version.
Intel Inspector Debug Extensions in the Visual Studio* IDE
Intel Inspector functionality appears in the Visual Studio* debugger in the following manner:
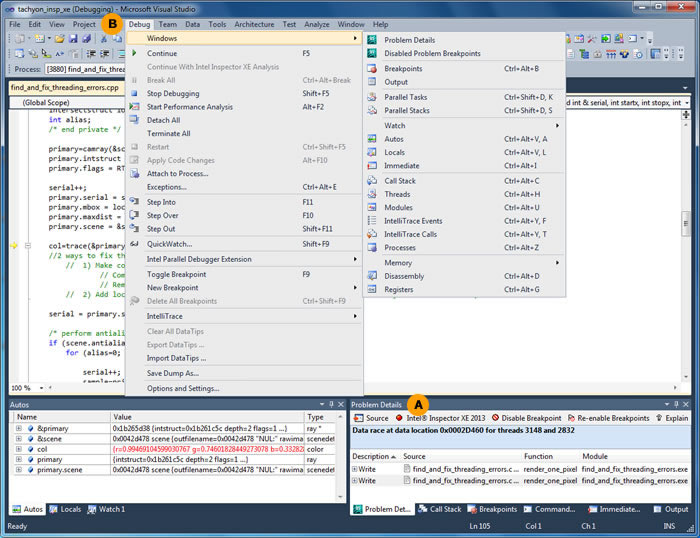
A |
The Problem Details pane appears automatically when a problem breakpoint occurs. Use this pane to view the same problem details found in the Intel Inspector result, duplicated within the debugger workspace for convenient referencing; and to disable and re-enable problem breakpoints. |
|
B |
Use the Debug > Windows > Problem Details menu option to reopen the Intel InspectorProblems Details pane. Use the Debug > Continue with Intel Inspector <version> Analysis menu option in conjunction with the Select analysis start location with debugger analysis configuration option to start checking for errors at a specific point in an application. |
|