External Memory Interfaces Agilex™ 7 M-Series FPGA IP Design Example User Guide
ID
772632
Date
4/01/2024
Public
A newer version of this document is available. Customers should click here to go to the newest version.
1. About the External Memory Interfaces Agilex™ 7 M-Series FPGA IP
2. Design Example Quick Start Guide for External Memory Interfaces Agilex™ 7 M-Series FPGA IP
3. Design Example Description for External Memory Interfaces Agilex™ 7 M-Series FPGA IP
4. Document Revision History for External Memory Interfaces Agilex™ 7 M-Series FPGA IP Design Example User Guide
2.1. Creating an EMIF Project
2.2. Generating and Configuring the EMIF IP
2.3. Configuring DQ Pin Swizzling
2.4. Generating the Synthesizable EMIF Design Example
2.5. Generating the EMIF Design Example for Simulation
2.6. Pin Placement for Agilex™ 7 M-Series EMIF IP
2.7. Compiling the Agilex™ 7 M-Series EMIF Design Example
2.8. Using the EMIF Design Example with the Test Engine IP
2.9. Generating the EMIF Design Example with the Performance Monitor
2.1.1.3.1. Generating a Custom Memory Preset File for DDR4
2.1.1.3.2. Guidelines for Selecting the DDR4 DRAM Component Package Type
2.1.1.3.3. Generating a Custom Memory Preset File for DDR5
2.1.1.3.4. Guidelines for Selecting the DDR5 DRAM Component Package Type
2.1.1.3.5. Generating a Custom Memory Preset File for LPDDR5
2.3.1. Example: DQ Pin Swizzling Within DQS group for x32 DDR4 interface
2.3.2. Example: Byte Swizzling for a x32 DDR4 interface, using a memory device of x8 width
2.3.3. Combining Pin and Byte Swizzling
2.3.4. Example: Swizzling for a x32 + ECC interface
2.3.5. Example: Byte Swizzling for Lockstep Configuration
2.9. Generating the EMIF Design Example with the Performance Monitor
You can use the Performance Monitor to check the performance metrics of the EMIF interface.
- When generating the design example, set the Enable performance monitor parameter to True. This parameter causes the generated design example to include a performance monitor, known as the PMON Monitoring Intel FPGA IP, which allows you to measure performance on an AXI4 mainband interface. The performance monitor is a synthesizable block consisting of control and status registers that let you configure and modify the performance metrics of the EMIF Interface. PMON allows you to measure the following performance metrics:
- Read latency
- Write latency
- Read efficiency
- Write efficiency
- Overall efficiency
- Subchannel efficiency
- Subchannel back pressure
- Expected transactions in subchannel
Note: Do not run any traffic on the interface that PMON is monitoring, while you are configuring PMON. Failure to observe this restriction can result in inaccurate measurements.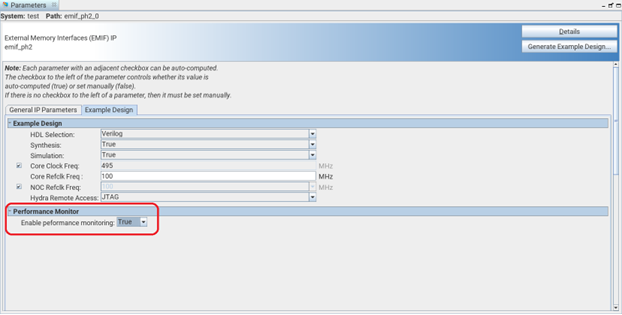
- To open the design example, click File > Open project, and navigate to the Quartus® Prime Pro Edition software folder containing the design example directory, such as:
<project_directory>/<example_design_directory>/qii/ed_synth.qpf
Click Open.
- You can make the necessary pin assignments in the .qsf file or in the Pin Planner.
- To begin compilation, click Processing > Start Compilation. The successful completion of compilation generates a .sof file, which you can use to run the design on hardware
- Load the pmon_library.tcl file in the system-console by entering the following command:
source pmon_library.tcl
- Set the metric configuration on desired AXI4 performance monitors:
pmon_set_all basic_eff
- Clear the counters and internal state of all performance monitors by typing the following command:
pmon_reset_counter_data_all
- Run traffic over the interface by typing:
testengine_run
- Read the efficiency metrics on the AXI4 performance monitor by typing:
pmon_read_all