P-Tile Avalon® Streaming Intel® FPGA IP for PCI Express* User Guide
A newer version of this document is available. Customers should click here to go to the newest version.
E.6. View the Results
The Avery BFM includes a memory transaction test that runs a sequence of 10 memory write/read combinations, where the test writes to a memory location and immediately reads back from the same location. For details on the test, refer to mem_tr_test class in apci_top_rc.sv. When the test passes, the following is displayed:
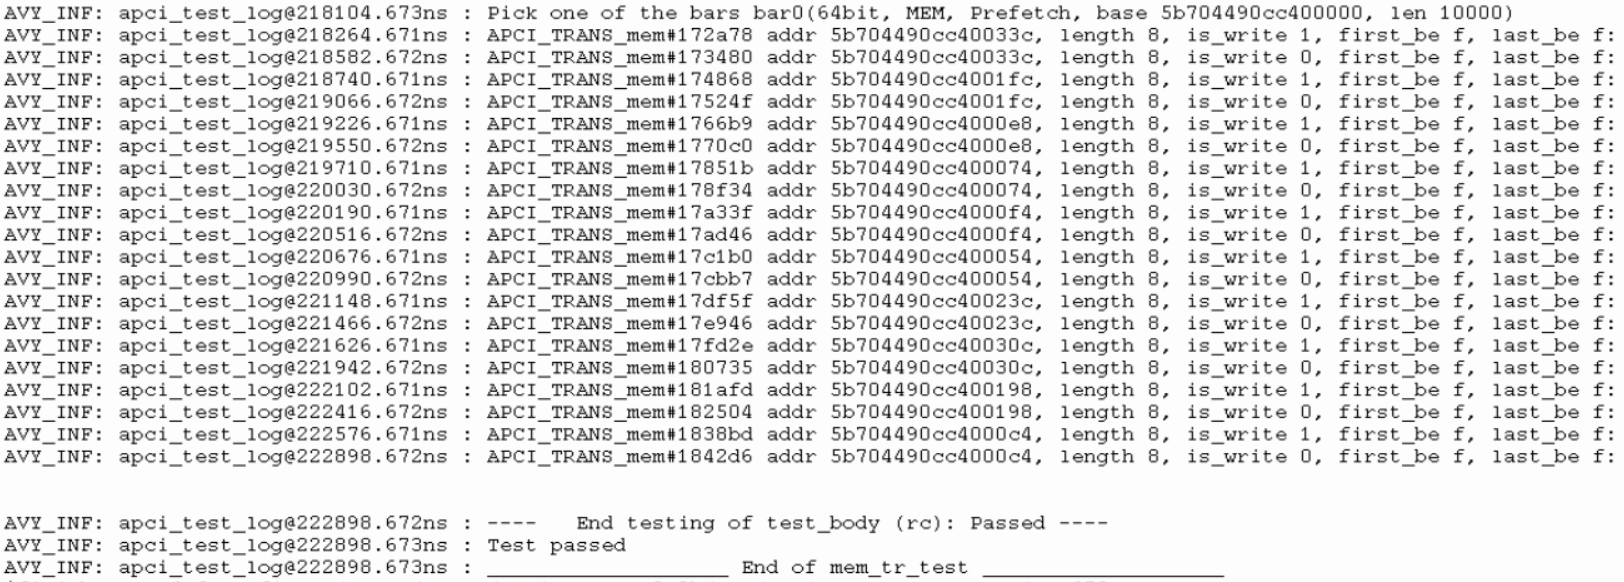
In the simulation results above, is_write = 1 denotes a memory write, and is_write = 0 denotes a memory read.
When you want to view the VPD waveforms, invoke the DVE GUI:
% dve
In the DVE GUI, click File -> Open Database, and select apci_top.vpd.
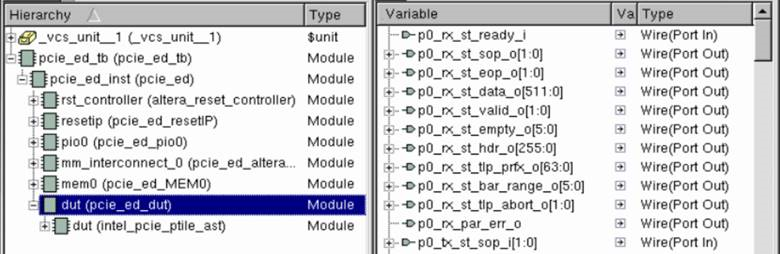
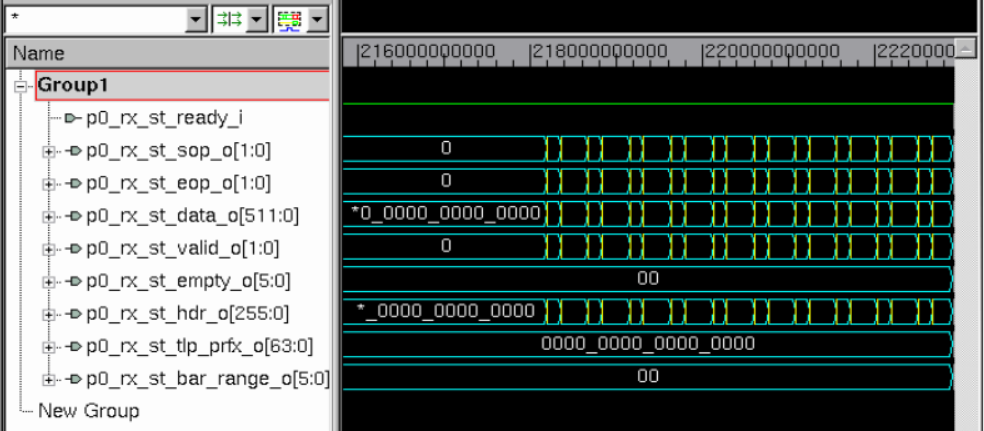
To add waveforms, select a component (e.g. dut) in the Hierarchy pane, select signals in the Variable pane, and then add them to the Wave pane.
In addition, the Avery BFM enables dumping traffic into three text files to facilitate the debugging of the transaction layer, data link layer, and physical layer functions:
In apci_top_rc.sv:
initial begin
rc = new("rc", null, APCI_DEVICE_rc, 1);
…
rc.port_set_tracker(-1, "tl" , 1);
rc.port_set_tracker(-1, "dll", 1);
rc.port_set_tracker(-1, "phy", 1);
…
end
- tracker_tl_rc.txt (transaction layer TLP dump)
- tracker_dll_rc.txt (data link layer DLLP dump)
- tracker_phy_rc.txt (physical layer Ordered Set dump)
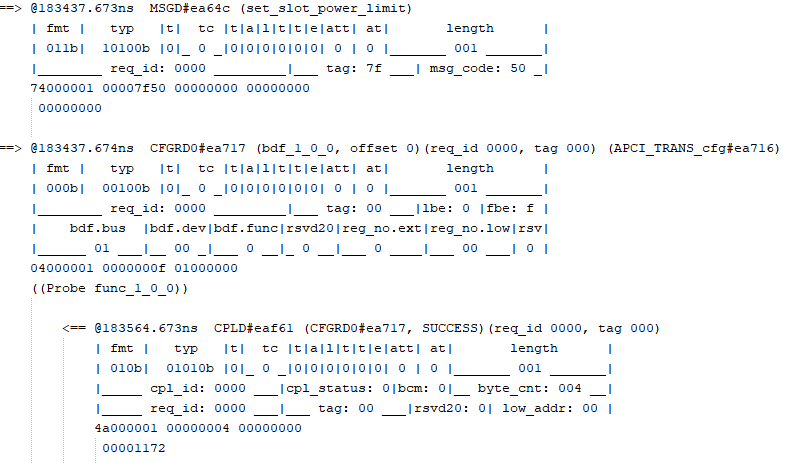
Here is an example of TLP transactions captured in tracker_tl_rc.txt: