Developer Guide
FPGA Optimization Guide for Intel® oneAPI Toolkits
A newer version of this document is available. Customers should click here to go to the newest version.
Measure Kernel Performance
The Profiler instruments and connects performance counters in a daisy chain throughout the pipeline generated for the kernel program. The host then reads data collected by these counters. For example, in PCI Express® (PCIe®)-based systems, the host reads the Profiler data over the PCIe interface.
Consider the following SYCL example code:
// Vector Add Kernel
h.single_task<VectorAdd>([=]() {
  for (int i = 0; i < kSize; ++i) {
    r[i] = a[i] + b[i];
  }
});
The profiler instruments the pipeline created from this design as shown in Figure 1. Performance counters are added to each load and store instruction, which are hooked together in a daisy chain that connects to the CRA interface.
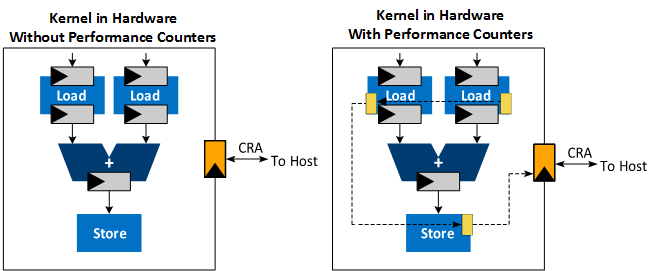
Applications that use many pipes or memory accesses might stall frequently to enable the completion of memory transfers. The dynamic profiler collects various performance metrics such as stall, occupancy, idle, and bandwidth data at these points in the pipeline to help identify memory or pipe operations that create stalls.