A newer version of this document is available. Customers should click here to go to the newest version.
Intel® oneAPI FPGA Handbook
Introduction To FPGA Design Concepts
Intel oneAPI FPGA Development
Defining a Kernel for FPGAs
Debugging and Verifying Your Design
Analyzing Your Design
Optimizing Your Kernel
Optimizing Your Host Application
Integrating Your RTL IP Core Into a System
RTL IP Core Kernel Interfaces
Loops
Pipes
Data Types and Arithmetic Operations
Parallelism
Memories and Memory Operations
Libraries
Additional FPGA Acceleration Flow Considerations
Additional SYCL* HLS Flow Considerations
FPGA Optimization Flags, Attributes, Pragmas, and Extensions
Quick Reference
Additional Information
Document Revision History for the Intel oneAPI FPGA Handbook
Notices and Disclaimers
Refactor the Loop-Carried Data Dependency
Relax Loop-Carried Dependency
Transfer Loop-Carried Dependency to Local Memory
Minimize the Memory Dependencies for Loop Pipelining
Unroll Loops
Fuse Loops to Reduce Overhead and Improve Performance
Optimize Loops With Loop Speculation
Remove Loop Bottlenecks
Improve fMAX/II with Shannonization
Optimize Inner Loop Throughput
Improve Loop Performance by Caching Data in On-Chip Memory
Global Memory Bandwidth Use Calculation
Manual Partition of Global Memory
Partitioning Buffers Across Different Memory Types (Heterogeneous Memory)
Partitioning Buffers Across Memory Channels of the Same Memory Type
Ignoring Dependencies Between Accessor Arguments
Contiguous Memory Accesses
Static Memory Coalescing
Use SYCL Shared Library With Third-Party Applications
Use of RTL Libraries for FPGA
Object Manifest File Syntax of an RTL Library
Restrictions and Limitations in RTL Support
Intel® Stratix® 10 and Intel Agilex® 7 Design-Specific Reset Requirements for Stall-Free and Stallable RTL Libraries
Stall-Free RTL
Specify Schedule FMAX Target for Kernels (-Xsclock=<clock target>)
Create a 2xclock Interface (-Xsuse-2xclock)
Disable Burst-Interleaving of Global Memory (-Xsno-interleaving=<global_memory_name>)
Force Ring Interconnect for Global Memory (-Xsglobal-ring)
Force a Single Store Ring to Reduce Area (-Xsforce-single-store-ring)
Force Fewer Read Data Reorder Units to Reduce Area (-Xsnum-reorder)
Disable Hardware Kernel Invocation Queue (-Xsno-hardware-kernel-invocation-queue)
Modify the Handshaking Protocol Between Clusters (-Xshyper-optimized-handshaking)
Disable Automatic Fusion of Loops (-Xsdisable-auto-loop-fusion)
Fuse Adjacent Loops With Unequal Trip Counts (-Xsenable-unequal-tc-fusion)
Pipeline Loops in Non-task Kernels (-Xsauto-pipeline)
Control Semantics of Floating-Point Operations (-fp-model=<value>)
Modify the Rounding Mode of Floating-point Operations (-Xsrounding=<rounding_type>)
Global Control of Exit FIFO Latency of Stall-free Clusters (-Xssfc-exit-fifo-type=<value>)
Enable the Read-Only Cache for Read-Only Accessors (-Xsread-only-cache-size=<N>)
Control Hardware Implementation of the Supported Data Types and Math Operations (-Xsdsp-mode=<option>)
Generate Register Map Wrapper (-Xsregister-map-wrapper-type)
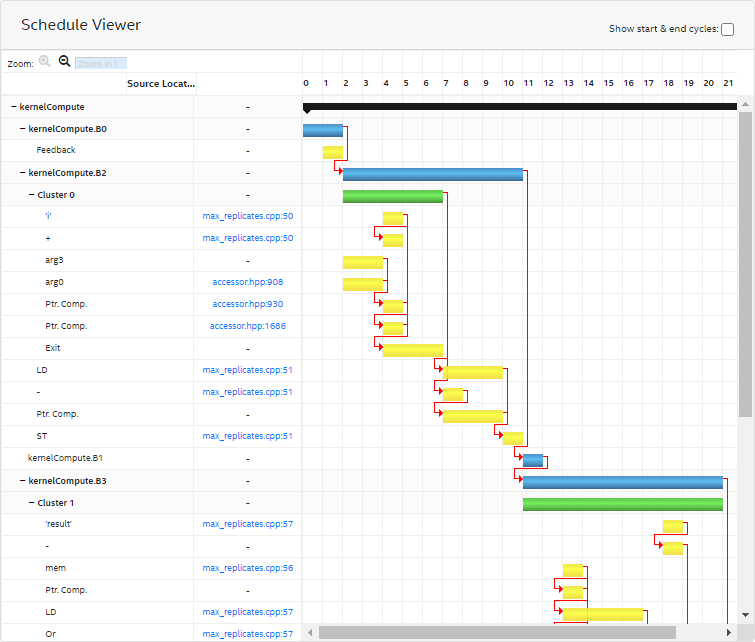
Schedule Viewer
The Schedule Viewer displays a static view of the scheduled cycle and latency of a clustered group of instructions in your design. Use this report to view loop bottlenecks such as fMAX/II bottlenecks, memory dependency, and occupancy limiter.
To view the Schedule Viewer, click Views > Schedule Viewer.
In the Schedule Viewer:
- Columns depict the clock cycles.
- Rows display a list of kernels, blocks, clusters, and instructions ranked by the order of execution.
- The red arrows are dependency lines for each block, cluster, or instruction. The arrows show how each block, cluster, or instruction is dependent on other blocks, clusters, or instructions. Hovering over a node (bar) highlights its outgoing dependency lines.
- Each row represents a node and its start and end cycle.
- The bars are color-coded. Black indicates a kernel, blue indicates a block, green indicates a cluster, and yellow indicates an instruction.
Schedule Viewer
Parent topic: Review the FPGA Optimization Report