Understanding How Your Program Is Accessing Memory Helps You Get More from Your Hardware
Kevin O’Leary and Alex Shinsel, technical consulting engineers, Intel Corporation
@IntelDevTools
How your application accesses memory dramatically impacts performance. It's not enough to parallelize your application by adding threads and vectorization. Effective use of memory bandwidth is just as important. But often, software developers just don’t understand it. Tools that help minimize memory latency and increase bandwidth can help pinpoint performance bottlenecks and diagnose their causes. One such tool is Intel® Advisor, which has features to help optimize memory access and eliminate memory bottlenecks:
- Roofline analysis with the new Integrated Roofline feature
- Memory Access Pattern (MAP) analysis
- Memory footprint analysis
Get Great Performance
To get top performance out of your application, you need to know how well you're using all system resources. You can see some useful metrics on your overall program in the Summary view (Figure 1) in Intel Advisor, which gives you an indication of how well the application is vectorized.
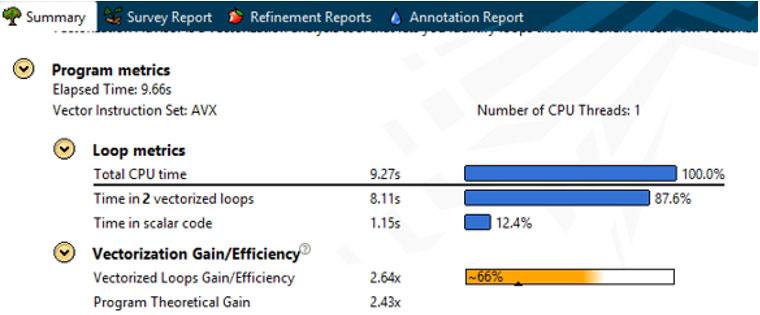
Figure 1. Summary view
You also need to systematically investigate the loops in your program that are taking the most time. A key metric for this is Vectorization Efficiency (Figure 2). In this example, Intel Advisor is showing a vectorization gain of 2.19x. But this only gives us a vectorization efficiency score of 55%. Where did 45% of the efficiency get lost? There are many factors that can cause inefficient vectorization.

Figure 2. Vectorization Efficiency view
Performance Problems
Bad Access Pattern
Indirect memory access is a common cause of slowdowns. Notice in the following code snippet that A can't be decoded without first decoding B[i]:
 for (i = 0; i < N; i++)

    A[B[i]] = C[i] * D[i];
This gives an irregular access pattern. The compiler can often vectorize this by using a technique called gather/scatter, which is great because it allows that loop to vectorize, but bad because these gather/scatter instructions aren’t as fast as sequential access. For fast code, it's important to arrange your data structures so that data is accessed in unit stride. (This article later presents how Intel Advisor can show you this information.)
Memory Subsystem Latency and Throughput
Getting your code to fit into the various memory caches and making optimal use of data reuse are crucial to getting the best performance out of your system. The following example indexes by i over a large piece of data. This data is too big to fit in cache, which is bad, and is made doubly so by A being a multidimensional array:
  for (i = 0; i < VERY_BIG; i++)

    c[i] = z * A[i][j];
References to A[i][j] and A[i+1][j] are not located next to each other in memory. So, to get each new reference, you need to bring in a new cache line―and potentially evict a cache line. This “cache thrashing” has a negative impact on performance. Techniques such as cache blocking (where you add a new inner loop that indexes over a much smaller range that is designed to fit in cache) can help optimize these types of applications.
Branchy Code
Applications with a lot of branches (for example, the following loop with if(cond(i)) can be vectorized using mask registers to block the single instruction multiple data (SIMD) lanes where the condition is not true. In these iterations, a SIMD lane does not do useful work. Intel Advisor uses the mask use metric (Figure 3). Three elements are being suppressed, giving a mask use of 5/8 = 62.5%.
  for (i = 0; i < MAX; i++)

    if (cond(i))

      C[i] = A[i] + B[i];
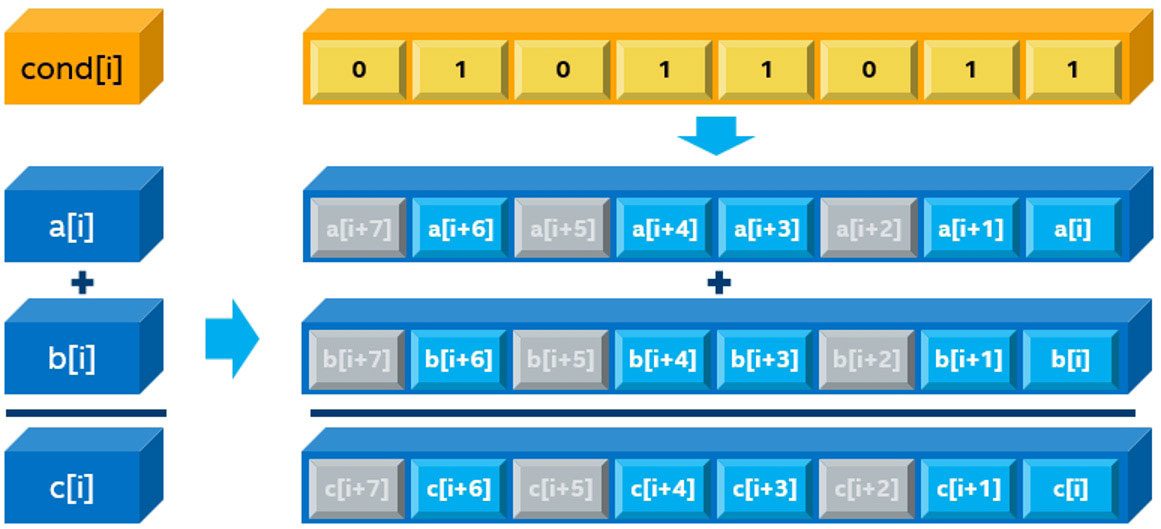
Figure 3. Mask use metric
You could access your data in a unit stride fashion and have excellent vector efficiency, but still not get the performance you need because of low mask use (Figure 4). Table 1 shows memory access types.
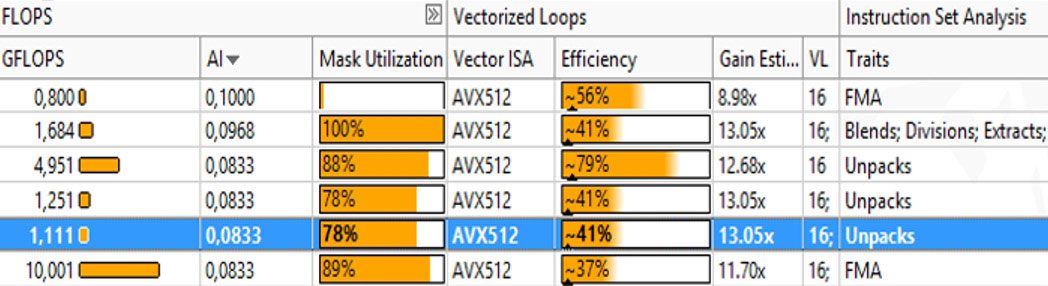
Figure 4. Mask use versus efficiency
Table 1. Memory access types
| Access Pattern | Small Memory Footprint | Large Memory Footprint |
|---|---|---|
| Unit Stride |
|
|
| Constant Stride |
|
|
| Irregular Access, Gather/Scatter |
|
|
Are You Bound by a CPU, VPU, or Memory?
If your application is memory bound, there are several features in Intel Advisor that can help you optimize it. But first, you need to determine if you're memory bound, or CPU or VPU bound. A quick way to determine this is by looking at your instructions. The Code Analytics windows (Figure 5) in Intel Advisor can give you a basic way to see the mix of instructions that your code is running.
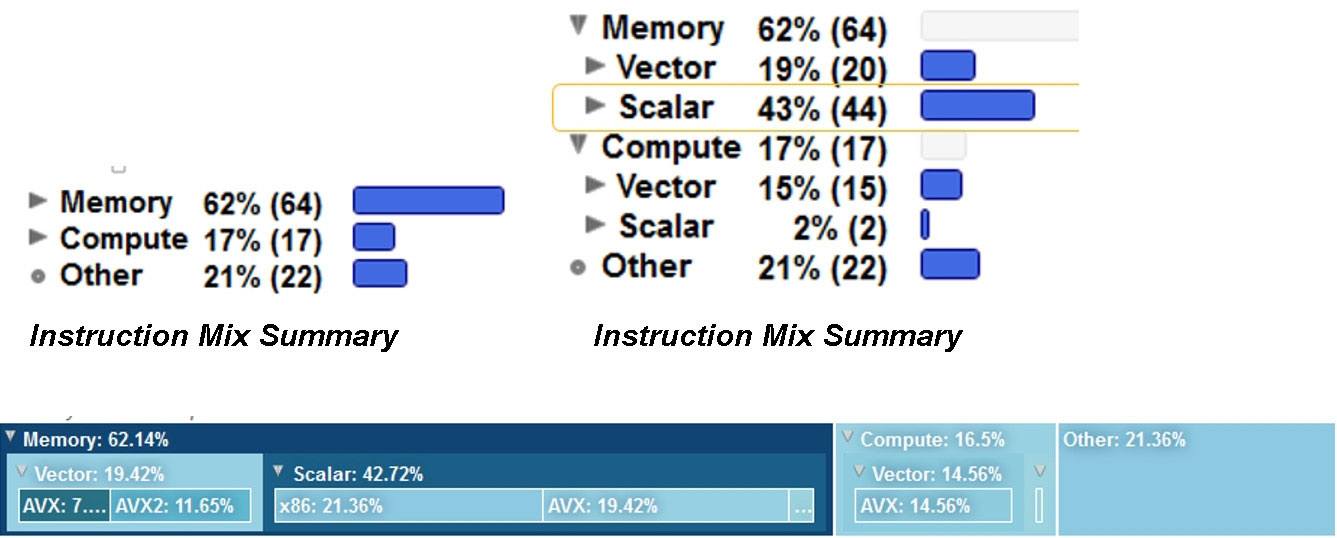
Figure 5. Code Analytics windows
A guideline is that applications that are running a lot of memory instructions tend to be memory bound, while those that are running a lot of compute instructions tend to be compute bound. Notice the breakdown in Figure 5. The ratio of scalar to vector instructions is particularly important. Try to have as many vector instructions as possible.
Another slightly more complicated technique is to use the Traits column in the Survey view (Figure 6) in Intel Advisor.
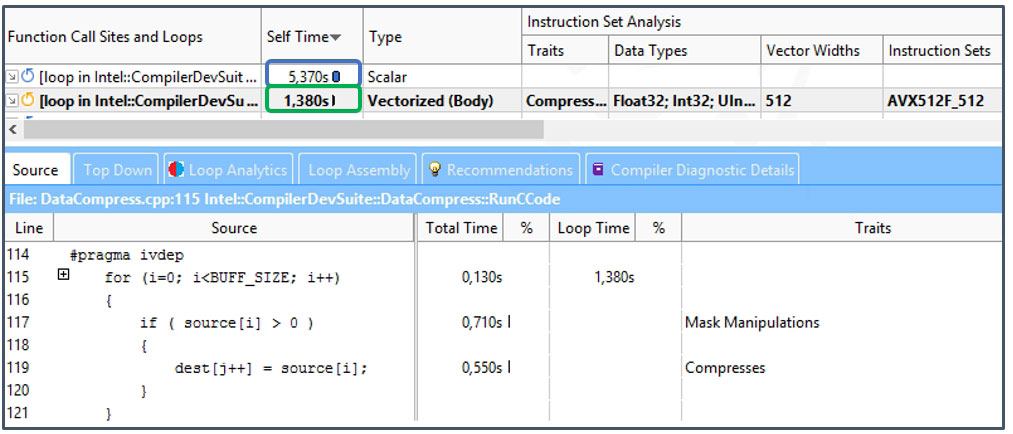
Figure 6. Traits column in the Survey view
Think of Traits as what the compiler needed to do to vectorize your loop. In the latest vector instructions sets, such as Intel® Advanced Vector Extensions 512 (Intel® AVX-512), there are many new instructions and idioms the compiler can use to vectorize your code. Techniques like register masking and compress instructions, shown in Figure 6, do allow applications to vectorize when this was not previously possible—but sometimes at a cost. Anything the compiler needed to do to get your data structures to fit in a vector (such as memory manipulation) often appears in the Traits column. These traits often indicate a problem that you can explore with a Memory Access Pattern analysis.
Helpful Optimization Features
Roofline Analysis
A Roofline chart is a visual representation of application performance in relation to hardware limitations, including memory bandwidth and computational peaks. It was first proposed by researchers at the University of California at Berkeley in the 2008 paper, Roofline: An Insightful Visual Performance Model for Multicore Architectures. In 2014, this model was extended by researchers at the Technical University of Lisbon in a paper called Cache-Aware Roofline Model: Upgrading the Loft. Traditionally, Roofline charts are calculated and plotted manually, but Intel Advisor now automatically builds Roofline plots.
The Roofline provides insight into:
- Location of your performance bottlenecks
- How much performance is left on the table because of bottlenecks
- Which bottlenecks are possible to address and which ones are worth addressing
- Why these bottlenecks are most likely occurring
- Your next steps

Figure 7. Roofline analysis
The horizontal lines in Figure 7 represent the number of floating-point or integer computations of a given type that your hardware can perform in a given span of time. The diagonal lines represent how many bytes of data a given memory subsystem can deliver per second. Each dot is a loop or function in your program, with its position indicating its performance, which is affected by its optimization and its arithmetic intensity (AI).
Integrated Roofline
The Integrated Roofline model offers a more detailed analysis, showing directly where the bottleneck comes from. Intel Advisor collects data for all memory types using cache simulation (Figure 8).
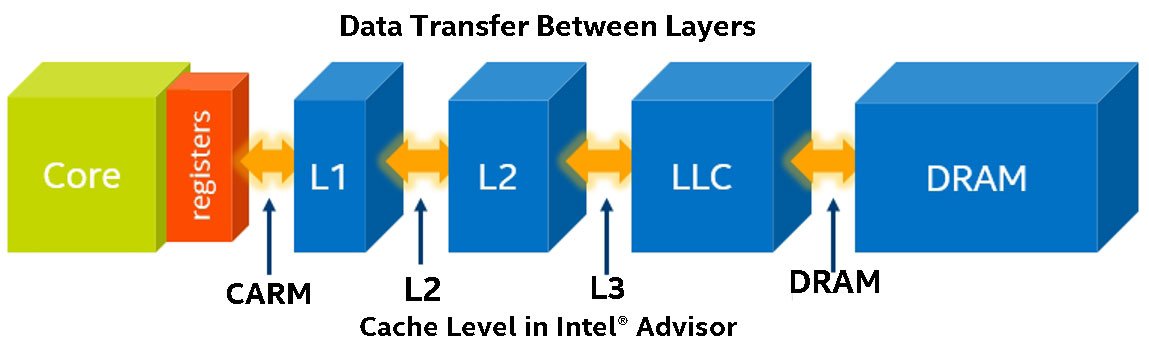
Figure 8. Cache simulation in Intel Advisor
With this data, Intel Advisor counts the number of data transfers for a given cache level and computes the specific AI for each loop and each memory level. By observing the changes in this traffic from one level to another, and then comparing them to respective roofs representing the best possible bandwidths for these levels, it's possible to pinpoint the memory hierarchy bottleneck for the kernel and determine optimization steps (Figure 9).
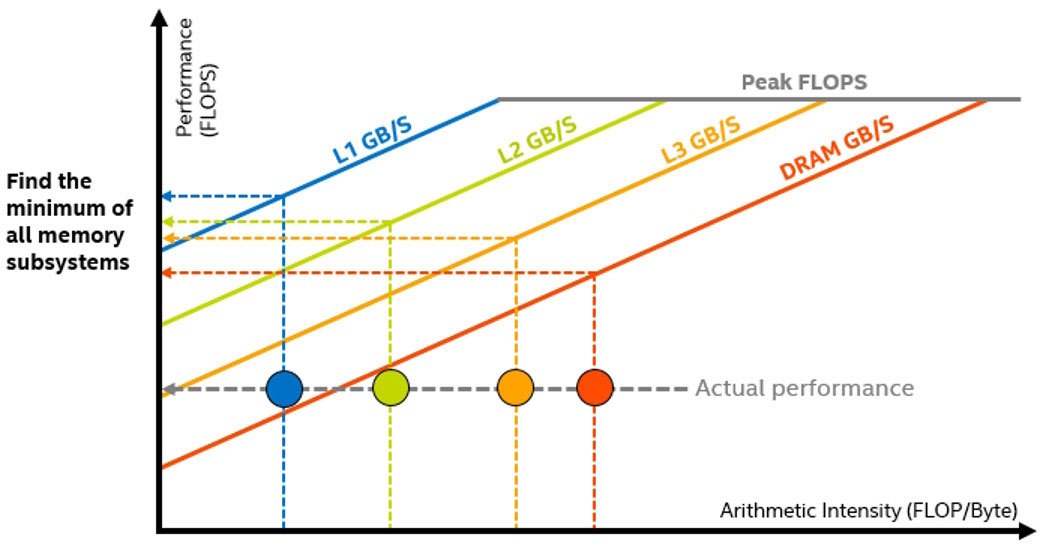
Figure 9. Pinpointing the memory hierarchy bottleneck
Memory Access Pattern (MAP) Analysis
MAP analysis in Intel Advisor gives the deepest insight into how you're accessing memory. Your memory access pattern affects the efficiency of vectorization and how much memory bandwidth you can ultimately achieve. The MAP collection observes data accesses while running and spots the instructions that contain the memory accesses. The data collected and analyzed appears in the Memory Access Patterns Report tab of the Refinement Reports window.
To run a MAP analysis from the GUI (Figure 10), you need to select loops using the checkboxes in the Survey report and run a MAP collection.

Figure 10. Memory Access Patterns report
You can also run a MAP collection from the command line. Use the -mark-up-list option to select loops to be analyzed.
  advixe-cl -collect map -mark-up-

  list=Multiply.c:78,Multiply.c:71,Multiply.c:50,Multiply.c:6

1 -project-dir C:/my_advisor_project -- my_application.exe
The Memory Access Patterns report provides information about the types of strides observed in the memory access operations while the loop runs. The tool reports both unit, uniform, and constant strides (Figure 11).
Unit and Uniform Stride Types
- Unit stride (stride 1) instruction accesses memory that consistently changes by one element from iteration to iteration.
- Uniform (stride 0) instruction accesses the same memory from iteration to iteration.
- Constant stride (stride N) instruction accesses memory that consistently changes by N elements (N>1) from iteration to iteration.
Variable Stride Types
- Irregular stride instruction accesses memory addresses that change by an unpredictable number of elements from iteration to iteration.
- Gather (irregular) stride is detected for v(p)gather* instructions on the Intel® Advanced Vector Extensions 2 (Intel® AVX2) instruction set architecture.
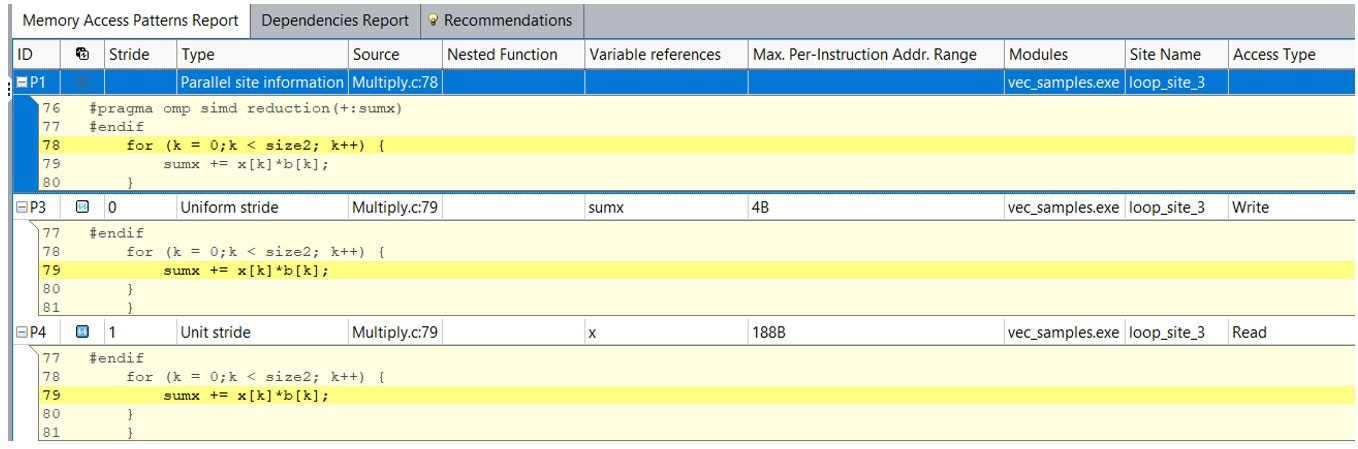
Figure 11. Stride types
Double-click any line in the Memory Access Patterns Report tab to see the selected operation's source code (Figure 12).
The Source and Details views (Figure 13) give you insights into another key Intel Advisor memory feature, Memory Footprint.
Memory Footprint Analysis
Memory Footprint is basically the range of memory for given loop accesses. This footprint can be a key indicator of your memory bandwidth. If the range is large, you might not be able to fit it in a cache. Optimization strategies such as cache blocking can make a big difference in these cases. Intel Advisor has three different memory footprint metrics (Figure 14).
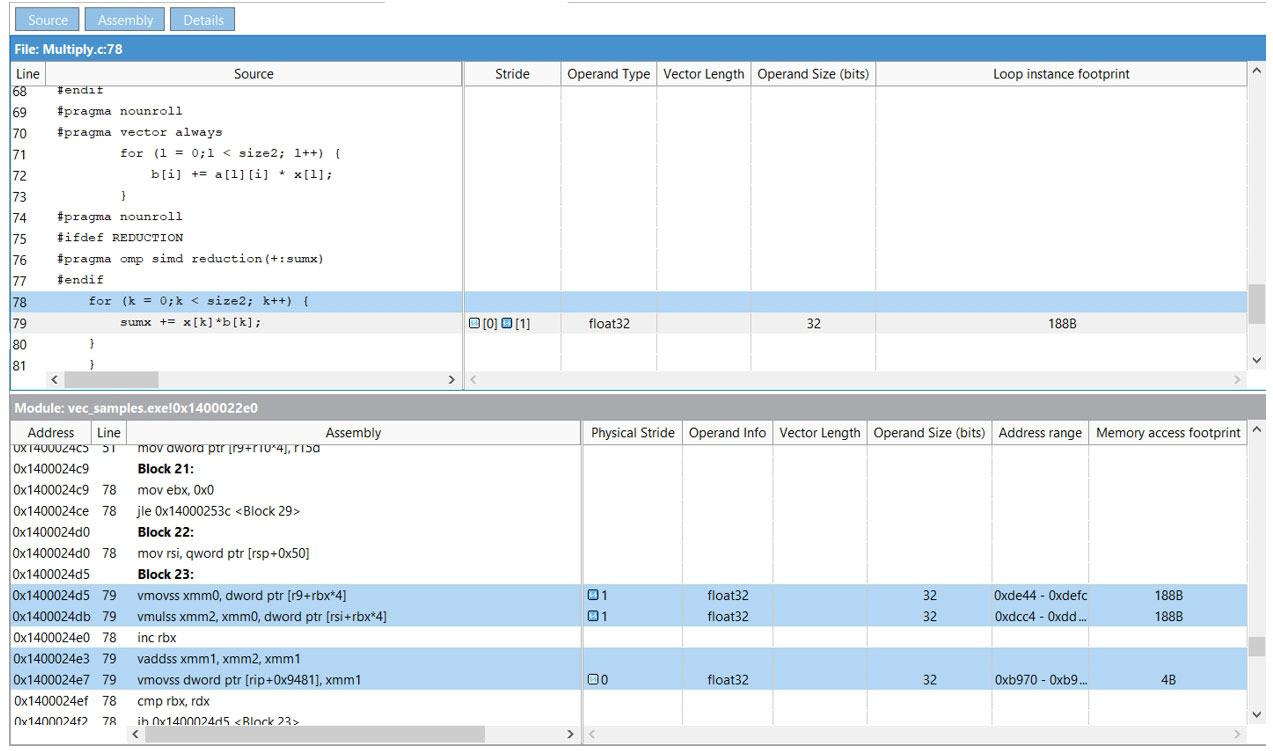
Figure 12. The selected operation's source code
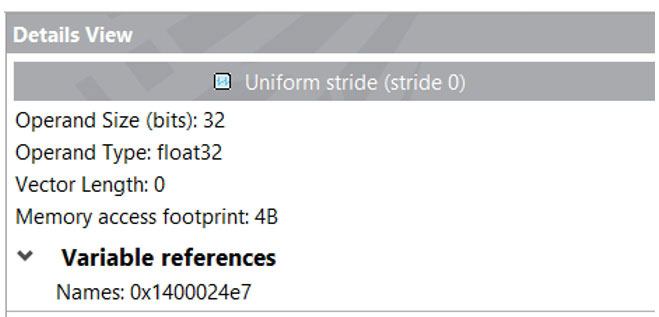
Figure 13. Details view
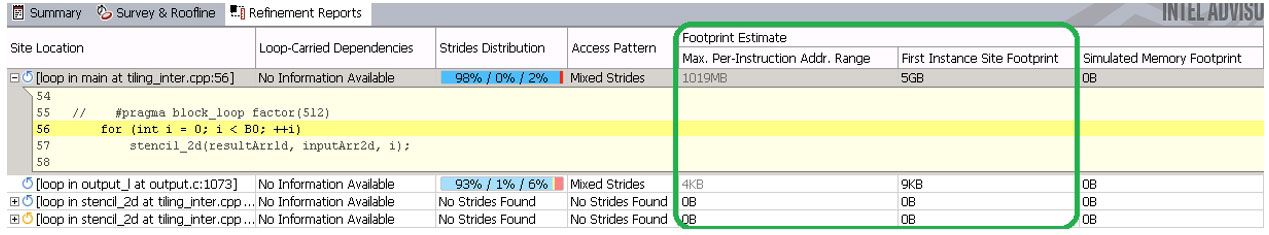
Figure 14. Memory footprint metrics
Two basic footprint metrics represent just some aspects of your memory footprint. These metrics are collected by default in Memory Access Pattern (MAP) analysis:
- Max Per-Instruction Address Range represents the maximum distance between minimum and maximum memory address values accessed by instructions in this loop. For each memory access instruction, the minimum and maximum address of its access is recorded and the maximum range of this address for all loop instructions is reported. It covers more than one loop instance, with some filtering, which is why sometimes Intel Advisor conveys uncertainty in this metric and reports it in gray.
- First Instance Site Footprint is a more accurate memory footprint, since it detects overlaps in address ranges in the loop iterations and gaps between address ranges accessed by the loop, but is calculated only for the first instance (call) of this loop.
There's a more advanced footprint calculated based on cache simulation, called the Simulated Memory Footprint. This metric shows the summarized and overlap-aware picture across all loop instances, but limited to one thread. It is calculated as the number of unique cache lines accessed during cache simulation multiplied by cache line size. To enable it in the GUI:
- In Project Properties, under Analysis Target, select Memory Access Patterns Analysis.
- Select the Enable CPU cache simulation checkbox.
- Select the Model cache misses and loop footprint simulation mode in the dropdown list (Figure 15).
- Select the loops of interest with the checkboxes in the Survey view and run a MAP analysis.
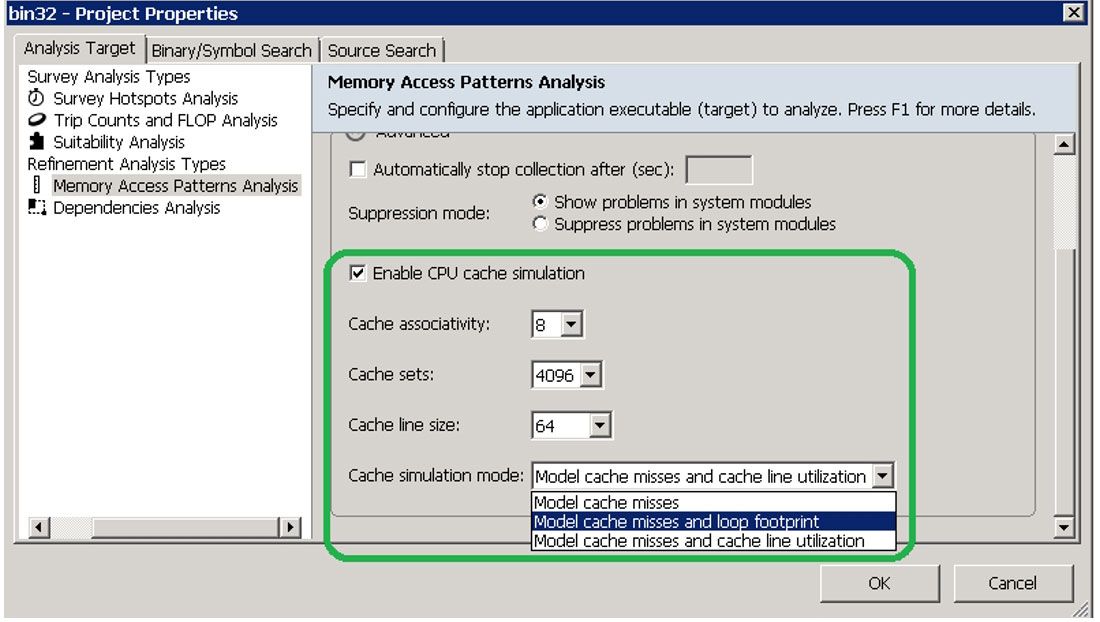
Figure 15. Simulated memory footprint
To enable the cache simulation in the command line, use the MAP command, as previously specified, with these options: -enable-cache-simulation and -cachesim-mode=footprint.
  advixe-cl -collect map -mark-up-

  list=tiling_inter.cpp:56,output.c:1073 -enable-cache-

  simulation -cachesim-mode=footprint -project-dir

  C:\my_advisor_project -- my_application.exe
You can see the results of the analysis in the Intel Advisor GUI Refinement Reports view (Figure 16). The more detailed cache-related metrics―like the total number of memory loads, stores, cache misses, and cache-simulated memory footprint―allow a more detailed study of loop behavior concerning memory. Table 2 shows Intel Advisor footprint metrics on applicability, limitations, and relevance for analyzing different types of codes.
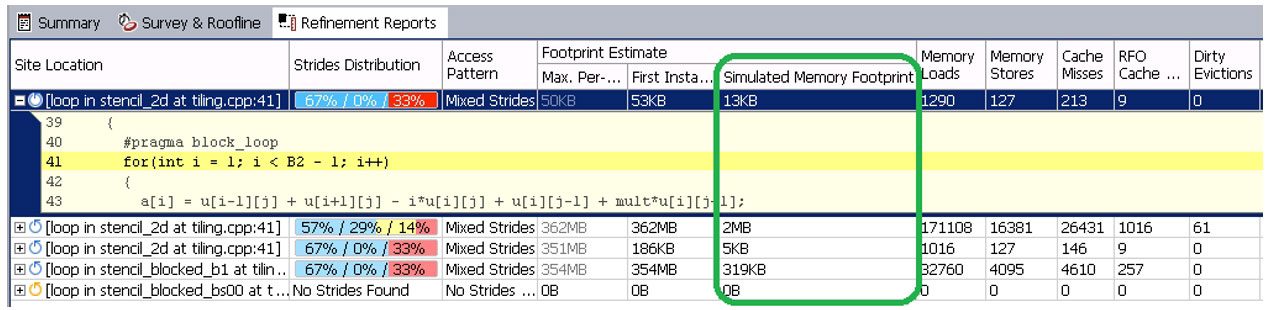
Figure 16. Refinement Reports view
Table 2. Intel Advisor footprint metrics
| Max Per- Instruction Address Range |
First Instance Site Footprint |
Simulated Memory Footprint |
|
|---|---|---|---|
| Threads analyzed for the loop or site | 1 | 1 | 1 |
| Loop instances analyzed | All instances but with some shortcuts | 1, only the first instance |
Depends on the loop-call-count limit option |
| Aware of address range overlap? | No | Yes | Yes |
| Suitable for codes with random memory access |
No | No | Yes |
A Real-World Example
Some of the most common problems in computational science require matrix multiplication. The list of domains that use matrices is almost endless, but AI, simulation, and modeling are just a few examples. The following sample algorithm is a triply nested loop that performs a multiply and an add for each iteration. Besides being computationally intensive, it also accesses a lot of memory. Let's use Intel Advisor to see how much.
  for(i=0; i<msize; i++) {

    for(j=0; j<msize; j++) {

      for(k=0; k<msize; k++) {

        c[i][j] = c[i][j] + a[i][k] * b[k][j];

      }

    }

  }
Create a Baseline
The elapsed time was 53.94 seconds for our initial run. Figure 17 is a cache-aware Roofline chart. The red dot is the main computational loop. It's far below even DRAM bandwidth, and even farther below L1 bandwidth, which is the maximum bandwidth we're trying to achieve. You can see the precise bandwidth it achieves at each level of the memory hierarchy using the Code Analytics tab for the loop (Figure 18).
Why is the performance so poor? How can it be improved? These are questions Intel Advisor was designed to answer. First, examine the Survey view (Figure 19) to see what's going on and whether Intel Advisor has any recommendations. Intel Advisor has noted an inefficient memory access pattern, and also that the loop has not been vectorized because of an assumed dependency. To examine the memory access pattern, we can run a memory access pattern (MAP) analysis (Figure 20).
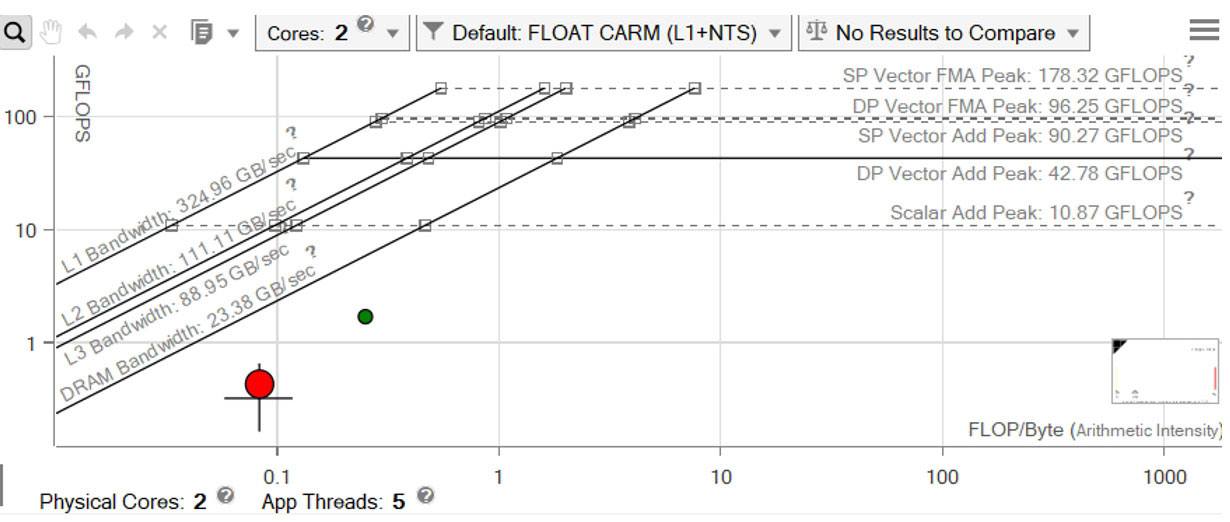
Figure 17. Cache-aware Roofline chart
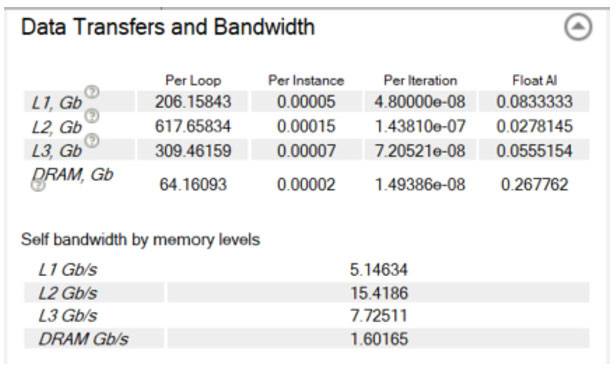
Figure 18. Data transfers and bandwidth
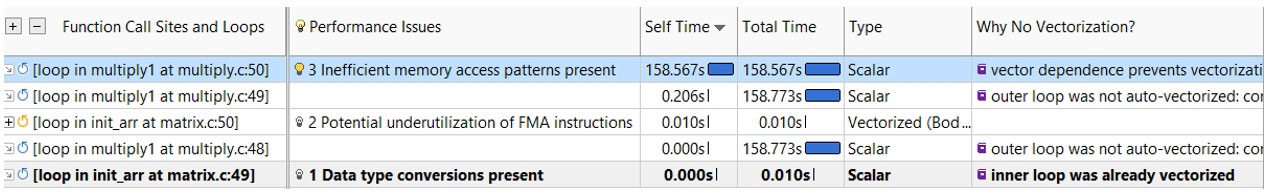
Figure 19. Survey view
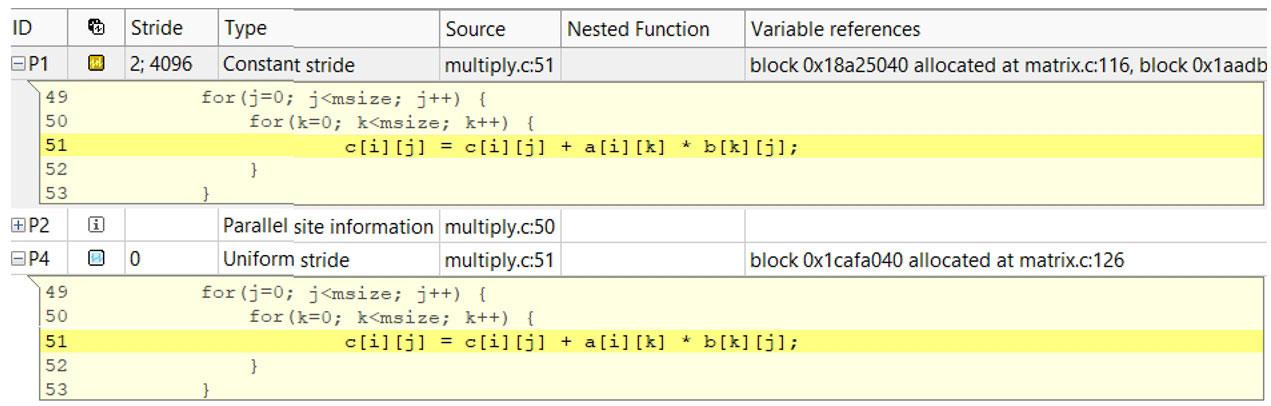
Figure 20. MAP analysis
Intel Advisor has detected a constant stride on the read access and a uniform stride of 0 for the write. The range of memory that's accessed is 32 MB, far bigger than any of the cache sizes (Figure 21). You can also see how well the caches are performing using the MAP report (Figure 22). Over 2,300 cache lines are missing, so it's no wonder performance is bad. But there are several ways to fix this.
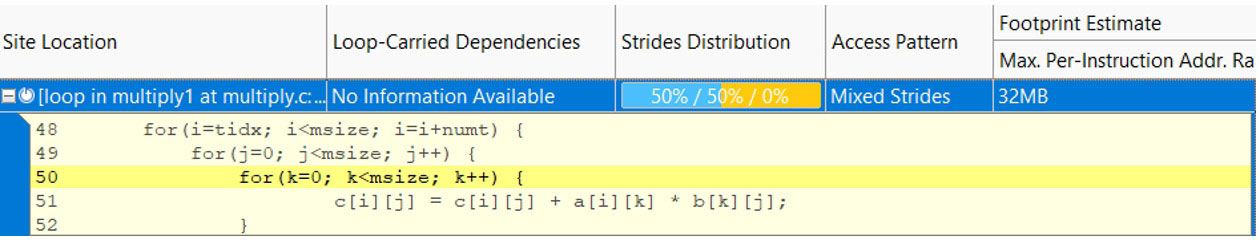
Figure 21. Strides distribution
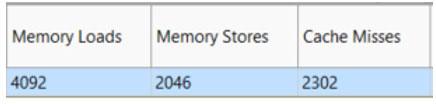
Figure 22. MAP report
Step 1
Do a loop interchange so that you don’t need a constant stride and also don’t need to access memory over such a wide range. You can also vectorize the loop by including a pragma ivdep that informs the compiler that you don’t have a dependency that prevents vectorization.
  for(i=tidx; i<msize; i=i+numt) {

    for(k=0; k<msize; k++) {

  #pragma ivdep

      for(j=0; j<msize; j++) {

        c[i][j] = c[i][j] + a[i][k] * b[k][j];

      }

    }

  }
The elapsed time for the new run is 4.12 seconds, an improvement of more than 12x. Why is the new performance so much better? First, let's look at the Integrated Roofline chart (Figure 23). Each of the red circles represents the bandwidth of the corresponding memory hierarchy: L1, L2, L3, and DRAM. It shows the computational loop's L1 memory bandwidth, represented by the leftmost red circle, is now 95 GB per second. You can also use the Survey view (Figure 24) to see that you're also now vectorized at 100% efficiency using Intel AVX2 instructions.
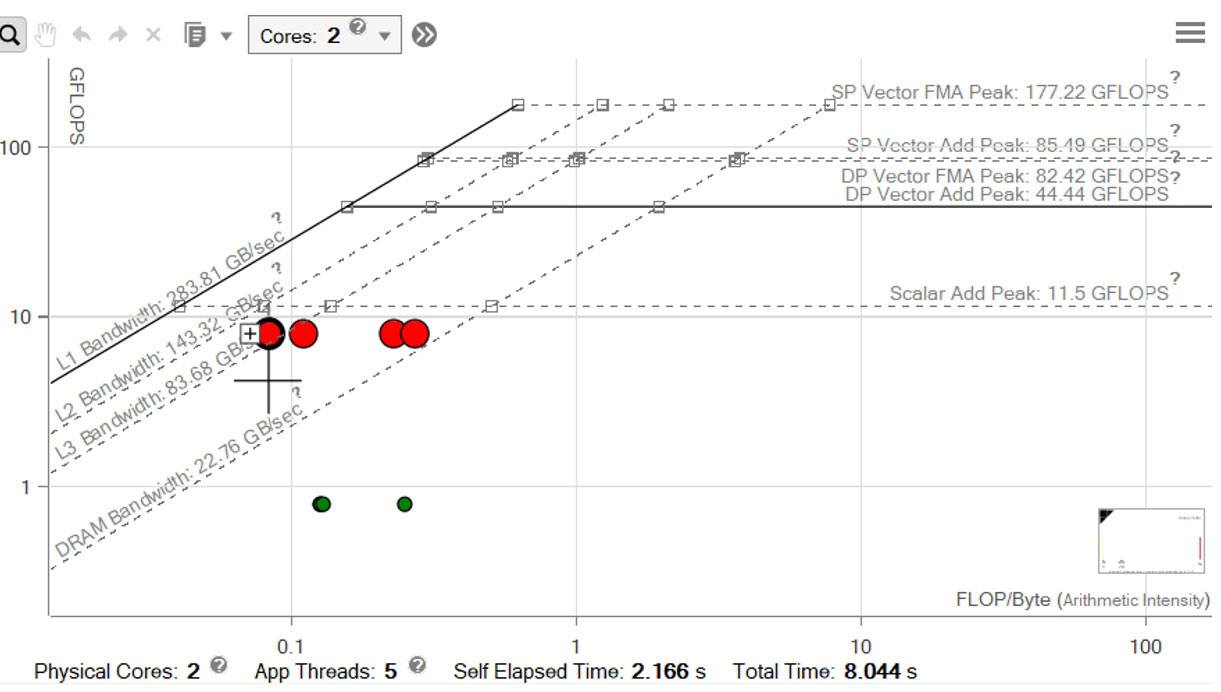
Figure 23. Integrated Roofline chart
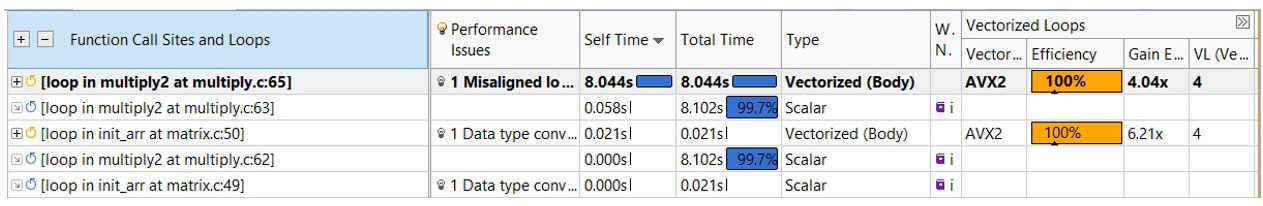
Figure 24. Survey view
The MAP report (Figure 25) informs that all accesses are now unit stride and the maximum address range is 16 KB, well within the range of the cache size. The cache is also performing much better (Figure 26). It dropped to 512 cache misses, down from 2,302. So it's getting better performance, but still isn't near the peak.
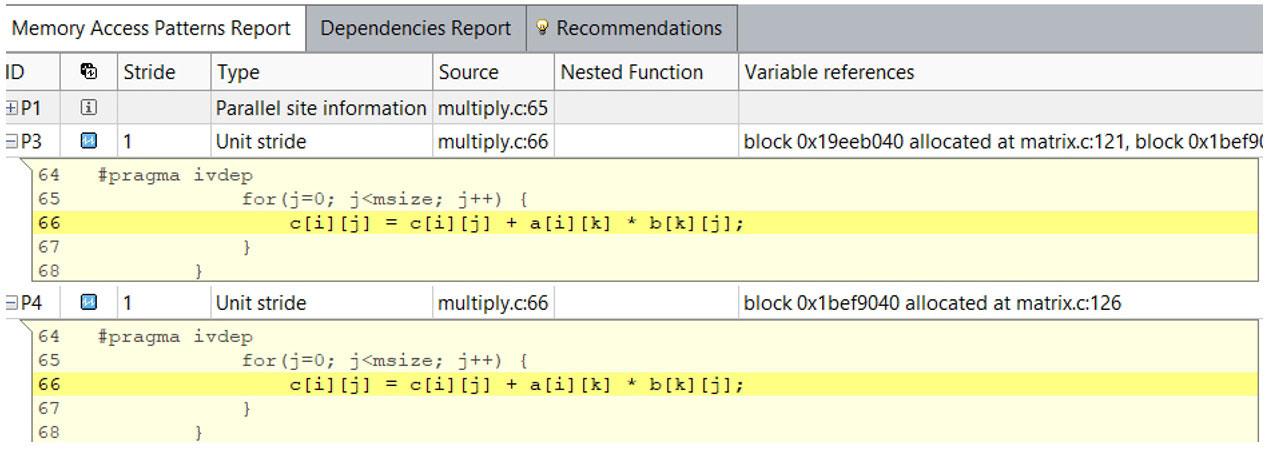
Figure 25. Map report
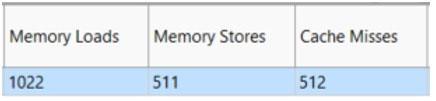
Figure 26. Cache performance
Step 2
Implement cache blocking so that your computations are over a smaller range of memory:
  for (i0 = ibeg; i0 < ibound; i0 +=mblock) {

    for (k0 = 0; k0 < msize; k0 += mblock) {

      for (j0 =0; j0 < msize; j0 += mblock) {

        for (i = i0; i < i0 + mblock; i++) {

          for (k = k0; k < k0 + mblock; k++) {

  #pragma ivdep

  #ifdef ALIGNED

    #pragma vector aligned

  #endif //ALIGNED

          #pragma nounroll

            for (j = j0; j < 10 + mblock; j++) {

              c[i] [j] = c[i] [j] + a[i] [k] * b[k] [j];

            }

          }

        }

      }

    }

  }
In the previous code, three additional nested loops were added so that computations are done in sections (or blocks). After one block is done, the computation moves to the next block. The elapsed time of our cache-blocked case is 2.60 seconds, a 1.58x improvement from the previous run (Figure 27). The loop's L1 memory bandwidth is now 182 GB per second, much closer to the L1 roof. Our vectorization and striding have not changed, but we now have only 15 cache misses for our inner loop, and our address range has been reduced to 480 bytes (Table 3).
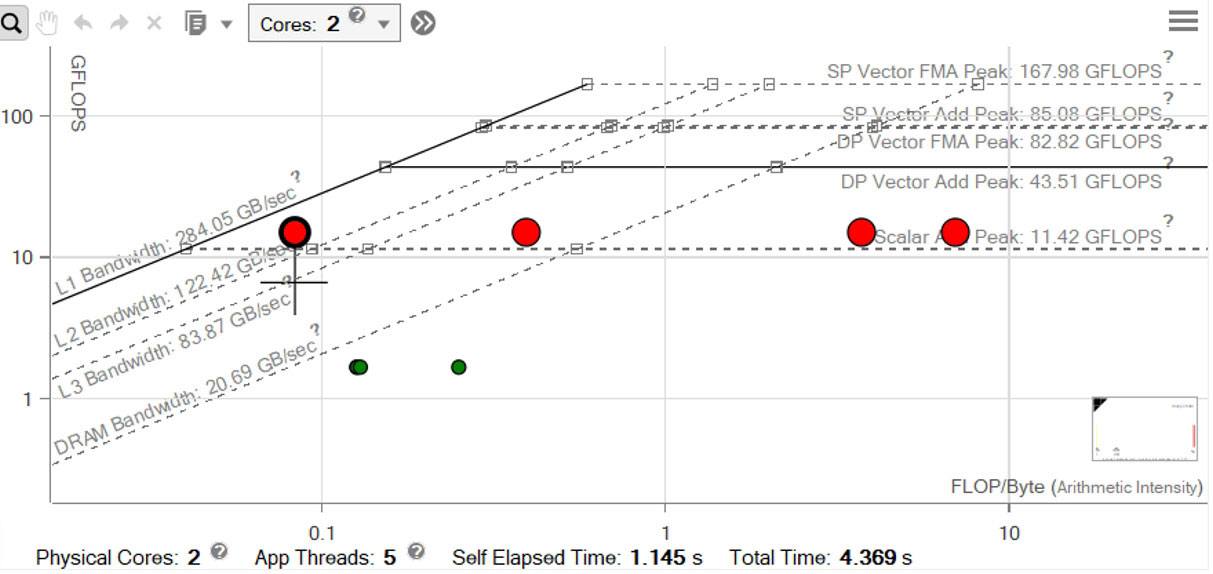
Figure 27. Performance improvements
Table 3. Summary of results
| Run | Time Elapsed, Seconds |
Total GFLOPS | Memory Address Range |
Cache Misses |
Improvement (Time) |
|---|---|---|---|---|---|
| Baseline | 53.94 | 0.32 | 32 MB | 2,302 | N/A (baseline) |
| Loop Interchange |
4.19 | 4.17 | 16 KB | 511 | 12.87x |
| Blocked | 2.6 | 6.61 | 480 B | 15 | 20.74 |
Optimize Memory Accesses
It's crucial to optimize the memory accesses of your program. Understanding how your program is accessing memory by using a tool like Intel Advisor can help you get the most out of your hardware. With the Roofline and new Integrated Roofline features of Intel Advisor, you can visualize memory bottlenecks. You can get even greater memory insight when you combine Roofline features with MAP analysis.
Related Resources
This article is from The Parallel Universe, Intel's quarterly magazine that helps take your software development into the future with the latest tools, tips, and training to expand your expertise. Read More
______
You May Also Like
Extend the Roofline Model
Listen
Design code for efficient vectorization, threading, memory usage, and GPU offloading. Intel Advisor is included as part of the Intel® oneAPI Base Toolkit.