Introduction
A Roofline chart is a visual representation of application performance in relation to hardware limitations, including memory bandwidth and computational peaks [1]. The Roofline is plotted with the X-axis as Arithmetic Intensity (Operations/Byte), and the Y-axis as the performance (Gigaoperations/Second), both in logarithmic scale. On it are "roofs" representing the limitations of processing power (horizontal lines) and memory bandwidth (diagonal lines), and dots representing your application's performance. Intel® Advisor can collect this information and plot it automatically in an interactive Roofline chart.

The earliest versions of the Roofline feature did not benefit all applications because these versions were limited to measuring floating-point computations [2,3]. This left the wide variety of applications that make heavy use of integer calculations (e.g. applications of machine learning or big data domains, databases applications, financial applications like crypto-coins etc.) unable to take advantage of this powerful feature.
Intel® Advisor 2019[7] added the capability to analyze applications with integers and generate roofs with respect to integer-based scalar and vector computation peaks.
Integer Roofline Model Basics
Metrics
The Integer Roofline model in Advisor is based on two metrics. The vertical axis is performance, a fairly straightforward metric calculated as the number of INT or INT+FLOAT operations per second (OPS). The horizontal axis is Arithmetic Intensity (AI).
Integer Operations
As the Integer Roofline is an evolving feature, the exact definition of INT Operations may change. Currently, ADD, ADC, SUB, MUL, IMUL, DIV, IDIV, INC/DEC, shifts, rotates etc. are counted as INT Operations. For strict integer operation usage, which allows you to exclude the loop counter operations (INC/DEC, shift, rotate) which are not strictly calculations, set the environment variable:
ADVIXE_EXPERIMENTAL=intops_strict
This will lead to only counting ADD, MUL, IDIV and SUB operations.
Arithmetic Intensity
Arithmetic Intensity[4] is a relationship between the data being read from memory and the arithmetic operations being performed on that data. If an application reads a total of A bytes of memory and performs a total of B scalar arithmetic operations, then:
Arithmetic Intensity = B/A
Examples:
- An application reads two 32-bit integers (a and b) then computes a + b:
Arithmetic Intensity = 1 int op / (2 mem ops * 4 bytes) = 0.125 INTOP/ByteMOV eax, a // read 4 bytes MOV ebx, b // read 4 bytes ADD eax, ebx // INTOP: eax = a + b
- An application reads three 32-bit integers (a, b, and c) and then computes (a + c) * (a + b):
Arithmetic Intensity = 3 int ops / (3 mem ops * 4 bytes) = 0.25 INTOP/ByteMOV eax, a // read 4 bytes MOV ebx, b // read 4 bytes ADD ebx, eax // INTOP: ebx = a + b MOV edx, c // read 4 bytes ADD eax, edx // INTOP: eax = a + c MUL ebx // INTOP: eax = (a + c) * (a + b)
Dots and Lines
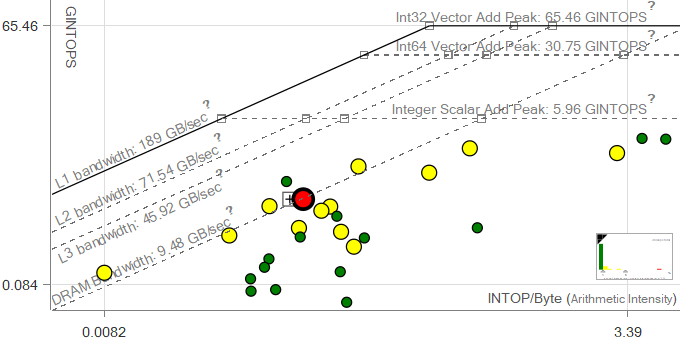 The Integer Roofline model in Advisor runs some benchmarks before analyzing a user's application, which allows it to plot the hardware limitations of the system, such as the bandwidths of various levels of the memory hierarchy, or computational limits. These are plotted on the chart as roofs, which represent the maximum performance the machine is capable of without taking advantage of further optimizations. For instance, the Scalar Add Peak represents the maximum number of addition operations that can be processed per second without vectorization.
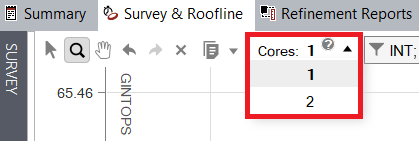 The roofs scale to the number of utilized cores. By default, Intel® Advisor detects the number of threads used by the application automatically, and sets the Roofline to plot for an appropriate number of cores. Users can manually control the scaling if desired using a dropdown in the GUI.
Each dot in the chart represents a loop or function in the analyzed program, and its position in the Roofline plot indicates performance and arithmetic intensity. The size and color of the dots in Advisor’s Roofline chart indicate how much of the total program time a loop or function takes. Small, green dots take up relatively little time, so are likely not worth optimizing. Large, red dots take up the most time, so they are the best candidates for optimization, especially if they have a large gap to the topmost attainable roofs (which means they have a lot of room for improvement).
Running an Integer Roofline Analysis
Collecting Roofline data is the same regardless of the type of computations concerned, and is documented along with the features of the Roofline interface in the Intel Advisor User Guide[5]. While a CLI command and GUI button for Roofline exist, these are simply a shortcut to collect a Survey analysis followed by a Trip Counts analysis with FLOP collection enabled. After data collection is complete, the Survey and Roofline will display floating point information by default; selection menus in the relevant portions of the interface allow you to switch to displaying integer-based or combined data instead.
Optimization with Integer Roofline
Let's work through optimizing a matrix multiplication function with the Intel Advisor Integer Roofline. We will begin with a naive implementation, which has predictably poor performance and is therefore quite low on the Roofline chart. Because this example application consists almost entirely of the multiplication function, the dot representing our loop is large and red, and will remain this way throughout our optimization process. If this were a real world implementation where the multiplication function is used as part of a larger program, we would expect the dot to shrink over the course of optimization as it became a smaller and smaller portion of the overall run time.
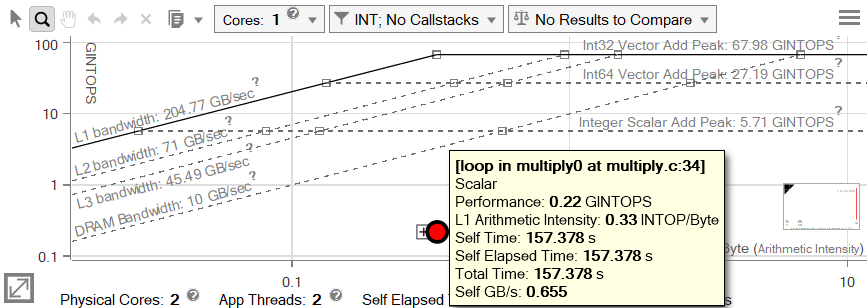
Note The Roofline chart shown here reports the application as using two threads, but has been set to scale roofs to a single core, because all actual calculation takes place on only one thread (the other is a primary launch/setup thread).
Metric Calculation
Let's explore where these numbers came from. The dot in the chart represents the loop in multiply.cpp on line 34:
| Line | Source |
|---|---|
|
|
For future reference, msize is 2048, but be aware that this may not be the actual number of iterations for the loops due to unrolling and/or vectorization. We can calculate the Arithmetic Intensity and GINTOPS the same way Advisor does by counting operations in the assembly.
| Address | Source Line | Assembly | Notes |
|---|---|---|---|
|
|
|
|
This loop accesses 24 bytes and performs 8 integer computations per iteration. If we know how many times this code ran, and how many seconds it took, we can calculate several other metrics.

We can find the required information in the Survey Report.
Note that the Trip Counts section is optional and appears only if you set your Trip Counts and OPs analysis to collect it.
With 1024 trips (iterations per loop call) and 4,194,304 loop calls, this code ran a grand total of 4,294,967,296 times.
8 INTOP / 24 bytes = 0.333 INTOP/byte (Arithmetic Intensity)
4,294,967,296 * 24 bytes = 103,079,215,104 bytes = 103.079 GB accessed
4,294,967,296 * 8 INTOP = 34,359,738,368 INTOP = 34.360 GINTOP
34.360 GINTOP / 157.378 seconds = 0.218 GINTOPS
These are the same numbers Advisor gives us, because this is how Advisor calculates them.
Step 1: Vectorization
Now that we understand where Advisor gets its numbers from, we can start trying to optimize our code. The lines above our dot are potential bottlenecks, with closer lines being more likely. By the purest reading of the Roofline chart, that would mean we should consider our DRAM bandwidth first, but the scalar add peak is also fairly close, so could also be a bottleneck worth investigating. Vectorization can also affect future optimizations, and the Survey report has already confirmed that this loop is scalar (not vectorized), so it's a good idea to get this out of the way now, especially since the Recommendations tab has a relevant entry that makes this optimization a relatively low-hanging fruit.
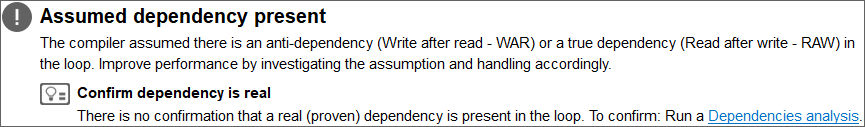
Running the Dependencies analysis reveals a Write-After-Read and Write-After-Write dependency, and the Recommendations tab updates to provide several potential workarounds, one of which is applicable here.
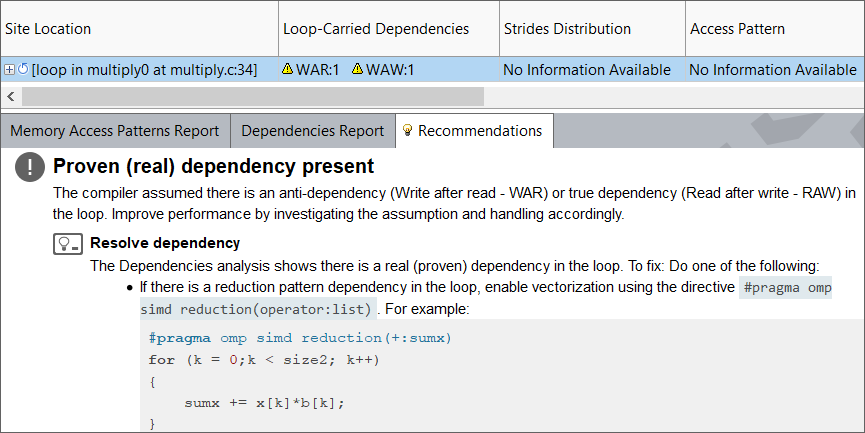
Our dependency is indeed from a reduction pattern, so adding this pragma to our code should allow the loop to vectorize, that is, to use Single Instruction Multiple Data (SIMD) instructions to process more data.
int i,j,k
for (i=0; i<msize; i++) {
    for (j=0; j<msize; j++) {
        #pragma omp simd reduction(+:c[i][j])
        for (k=0; k<msize; k++) {
            c[i][j] += a[i][k] * b[k][j];
        }
    }
}
Note There are multiple SIMD instruction sets, one of which is AVX-512, which provides operation mask registers that allow SIMD instructions to be performed on selected parts of vector registers. As the Integer Roofline is an evolving feature, “Mask Utilization” information is captured only for AVX-512 instructions in this release and will work only on hardware which supports AVX-512.
Step 2: Transposing the Matrix
Tip The Survey and Roofline can be viewed side by side. Clicking on a dot in the Roofline will highlight the corresponding loop in the Survey report and vice-versa.
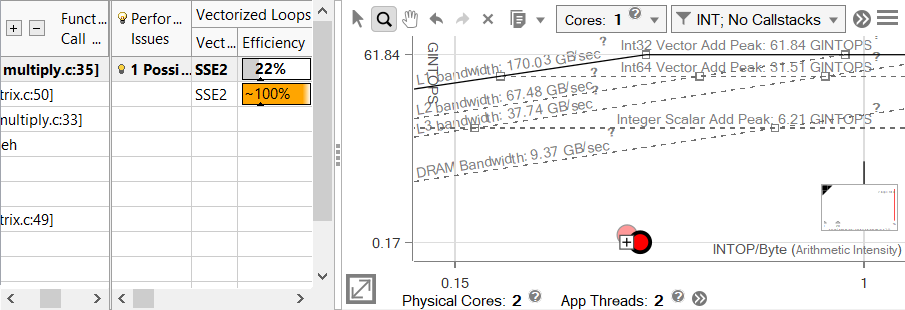
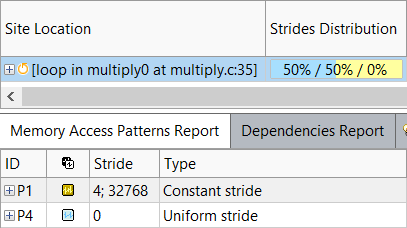 While our loop is now vectorized, the efficiency bar is gray, indicating that it's not achieving any speedup compared to its scalar self. However, we do have a new recommendation indicating that a poor access pattern may be causing vector inefficiency. Additionally, this same problem can also cause excessive cache misses, so it is contributing to both the memory and vectorization bottlenecks. Running a Memory Access Patterns (MAP) analysis confirms the problem.
This is hardly surprising. Matrix multiplication involves reading from the rows of one matrix and the columns of another. Because data is stored in row-major order in C++, reading subsequent entries from a row is efficient, as loading one entry will cache the next few so they can be easily accessed. However, reading subsequent entries from a column is slower, because caching the consecutive entries from one row doesn't help when the next load will be from a different row. In Fortran, data is stored in column-major order, so the situation is precisely the opposite, but the end result is the same: one of the matrices will be traversed in an inefficient order. The solution to this is to transpose the inefficient matrix so that its columns become rows.
int i,j,k
for (i=0; i<msize; i++) {
    for (j=0; j<msize; j++) {
        t[i][j] = b[j][i]
    }
}
for (i=0; i<msize; i++) {
    for (j=0; j<msize; j++) {
        #pragma omp simd reduction(+:c[i][j])
        for (k=0; k<msize; k++) {
            c[i][j] += a[i][k] * t[j][k];
        }
    }
}
Step 3: Use Improved Instructions
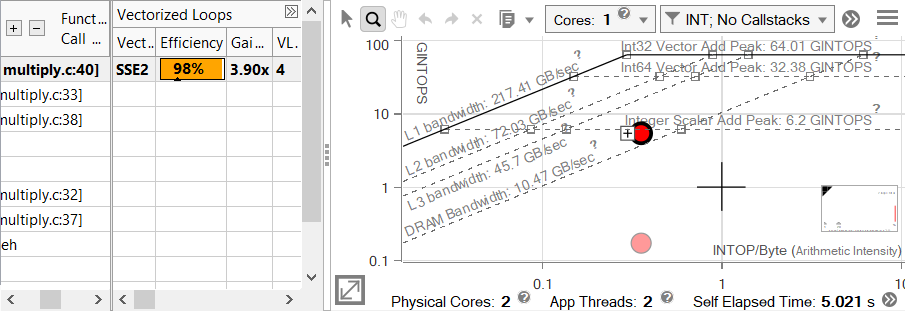
 Transposing the matrix had a massive effect on performance, and our loop is now sitting on the scalar add peak, despite being vectorized. Advisor's notification system provides an explanation - we're not using the highest instruction set available on this machine. Though the vector efficiency is at 98%, this value is scaled to the instruction set. When compiling this code, no instruction set was directly specified, so SSE2 was used, giving our integer loop a maximum benefit of 4x speedup. AVX2, the highest instruction set supported on this machine, offers twice that. We can take advantage of this simply by recompiling the code with the correct flag.
Step 4: Block for the Cache
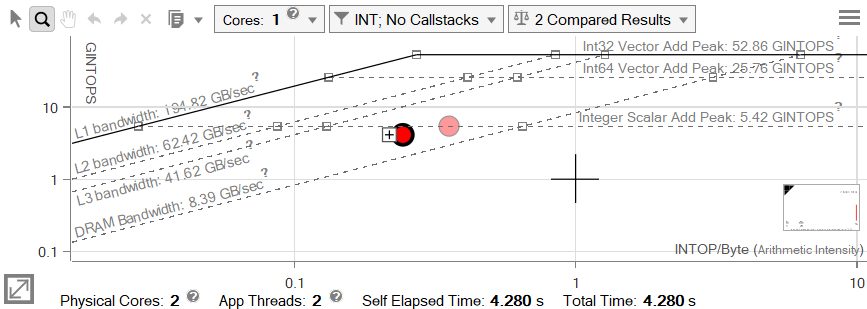
At first glance it appears that this change has negatively impacted performance, as both the Arithmetic Intensity and GINTOPS of our loop have gone down, but the Self Time indicates that the loop actually is faster (now 4.280s, previously 5.021s). This is because SSE2 instructions could process four integers with one operation, and AVX2 can process eight, meaning that the number of instructions has gone down. As the number of bytes has remained the same, the Arithmetic Intensity dropped. Furthermore, each of these instructions is slightly slower than the SSE2 instructions were, but do much more work in that time. The work gets done faster, but the number of instructions processed per second drops, explaining the lower GINTOPS.
 Since we've addressed the scalar add peak quite well, the next roofs we should investigate are the memory bandwidth roofs. Another MAP analysis shows that our memory usage is still far from ideal. This time it's not so much the stride as the span.
 By simply going in order across the entire matrix, the same data is reloaded more times than strictly necessary. This is demonstrated by these simplified animations. The examples shown multiply 4x4 matrices using a reduced cache that can hold 10 miniature cache lines, with each line holding two items. Lines in this example are selected for eviction based on how long it has been since they were used.
 If we divide the answer matrix up into tiles such that the entire tile can be calculated with data that fits in a given level of cache, we can minimize the number of misses on that level by calculating one tile at a time. Even in our reduced example animation we can see the benefits of this approach. We can determine the best size for the real tiles with some math. We're going to block for an L2 cache that holds 512KB.
CacheSize >= DataTypeSize * (N2 + 2 * (N * MatrixWidth))
524288 bytes >= 4 bytes * (N2 + 2 * (N * 2048))
131072 >= N2 + 4096N
The largest N that technically satisfies this is 31, but the matrix size doesn't divide evenly by this number. However, it does divide by 32, which would result in a data set only slightly too big to fit in L2. This will result in only a handful of extra cache misses, which are more than made up for by the amount of reuse we get from tiling the matrix. With CHUNK_SIZE defined as 32, our code can now be blocked to reuse cache.
int i,j,k,ichunk,jchunk,ci,cj;
for (i = 0; i < msize; i++) {
    for (j = 0; j < msize; j++) {
        t[i][j] = b[j][i];
    }
}
for (ichunk = 0; ichunk < msize; ichunk += CHUNK_SIZE) {
    for (jchunk = 0; jchunk < msize; jchunk += CHUNK_SIZE) {
        for (i = 0; i < CHUNK_SIZE; i++) {
            ci = ichunk + i;
            for (j = 0; j < CHUNK_SIZE; j++) {
                cj = jchunk + j;
                #pragma omp simd reduction(+:c[ci][cj])
                for (k = 0; k < msize; k++) {
                    c[ci][cj] += a[ci][k] * t[cj][k];
                }
            }
        }
    }
}
Step 5: Align Data
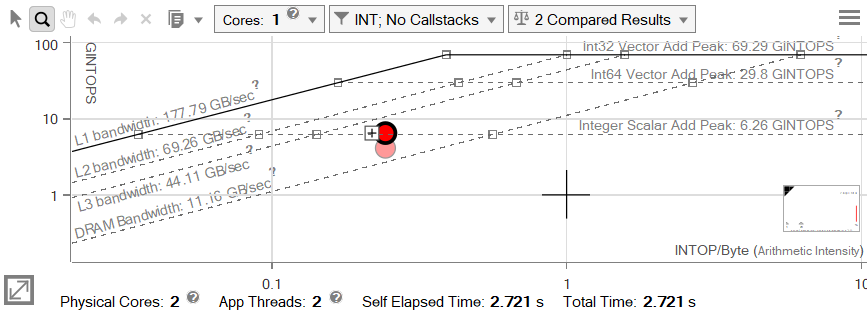
It may not look like there was much improvement, but remember that the Roofline axes are in logarithmic scale. The Self Time of the loop has been cut almost in half (from 4.280s down to 2.721s). Even so, we blocked the loop for L2, so the dot certainly shouldn't be sitting below the L3 line.
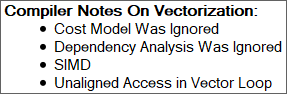
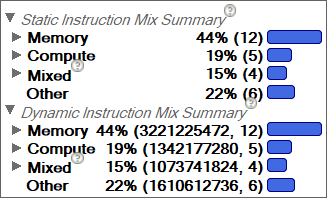 The Code Analytics tab provides a variety of useful information, including compiler notes. In this case, we see that there are unaligned accesses in our loop. While unaligned data is not insurmountable, working around it requires excessive memory manipulation. We can see this in the Instruction Mix summaries in the Code Analytics tab. In this case, the two types of Instruction Mix are the same, but they may differ in code containing conditionals; the Static Instruction Mix simply counts the instructions that are present in the code, while the Dynamic Instruction Mix records the actual number of executed instructions in a given loop at runtime. The general ratio of memory to compute can give you some idea of which bottlenecks apply.
We can ensure that our arrays are aligned by allocating them with _mm_malloc() or the equivalent call for a given compiler/OS. It is also wise to use a compiler flag to assure the compiler that the arrays being passed to our multiplication function do not overlap (/Oa or -fno-alias). The only change we need to make to our loop itself is the addition of a new pragma.
int i,j,k,ichunk,jchunk,ci,cj;
for (i = 0; i < msize; i++) {
    for (j = 0; j < msize; j++) {
        t[i][j] = b[j][i];
    }
}
for (ichunk = 0; ichunk < msize; ichunk += CHUNK_SIZE) {
    for (jchunk = 0; jchunk < msize; jchunk += CHUNK_SIZE) {
        for (i = 0; i < CHUNK_SIZE; i++) {
            ci = ichunk + i;
            for (j = 0; j < CHUNK_SIZE; j++) {
                cj = jchunk + j;
                #pragma vector aligned
                #pragma omp simd reduction(+:c[ci][cj])
                for (k = 0; k < msize; k++) {
                    c[ci][cj] += a[ci][k] * t[cj][k];
                }
            }
        }
    }
}
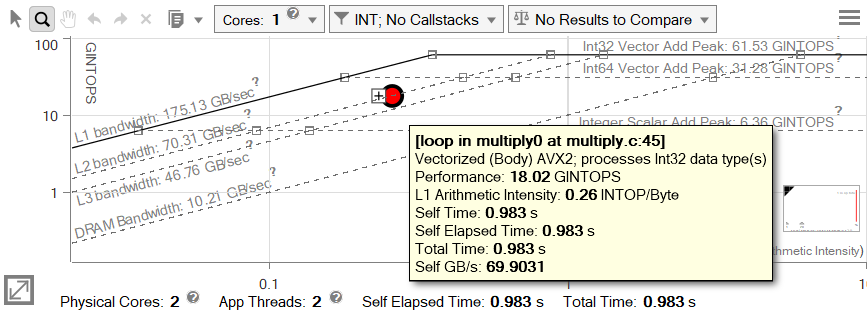
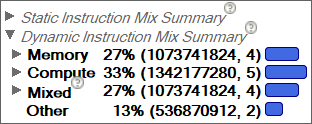 Aligning our data has eliminated the unnecessary memory instructions and pushed our dot up to the L2 bandwidth line, where we'd expect it to be. While there is still technically room for more optimization, at this point our loop takes less than a second to execute. By following Advisor's leads, we've achieved a whopping 160x speedup from the original time of 157.378s down to 0.983s.
References
- Roofline Performance Model at Lawrence Berkeley National Laboratory website
- Intel Advisor Roofline for floating-point operations at Intel website
- Intel® Advisor Tutorial: Use Automated Roofline Chart to Make Optimization Decisions
- Measuring Arithmetic Intensity at National Energy Research Scientific Computing Center website
- Intel® Advisor User's Guide: Roofline Analysis
- Intel® Advisor website
- Intel® Advisor 2019 Release Notes