A newer version of this document is available. Customers should click here to go to the newest version.
7.4.3.1. Model Analyzer GUI Description
When initially open the Model Analyzer GUI, you are prompted to open a .dot file or a compiler reports folder. You can also drag-and-drop files or folders to the Model Analyzer GUI.
If you have multiple model visualization available in a folder, you can switch between them by clicking File List and selecting a .dot file to view.
The Model Analyzer GUI header indicates either the folder name and open .dot file name (if you opened a folder) or only the open .dot file name (if you opened only a .dot file).
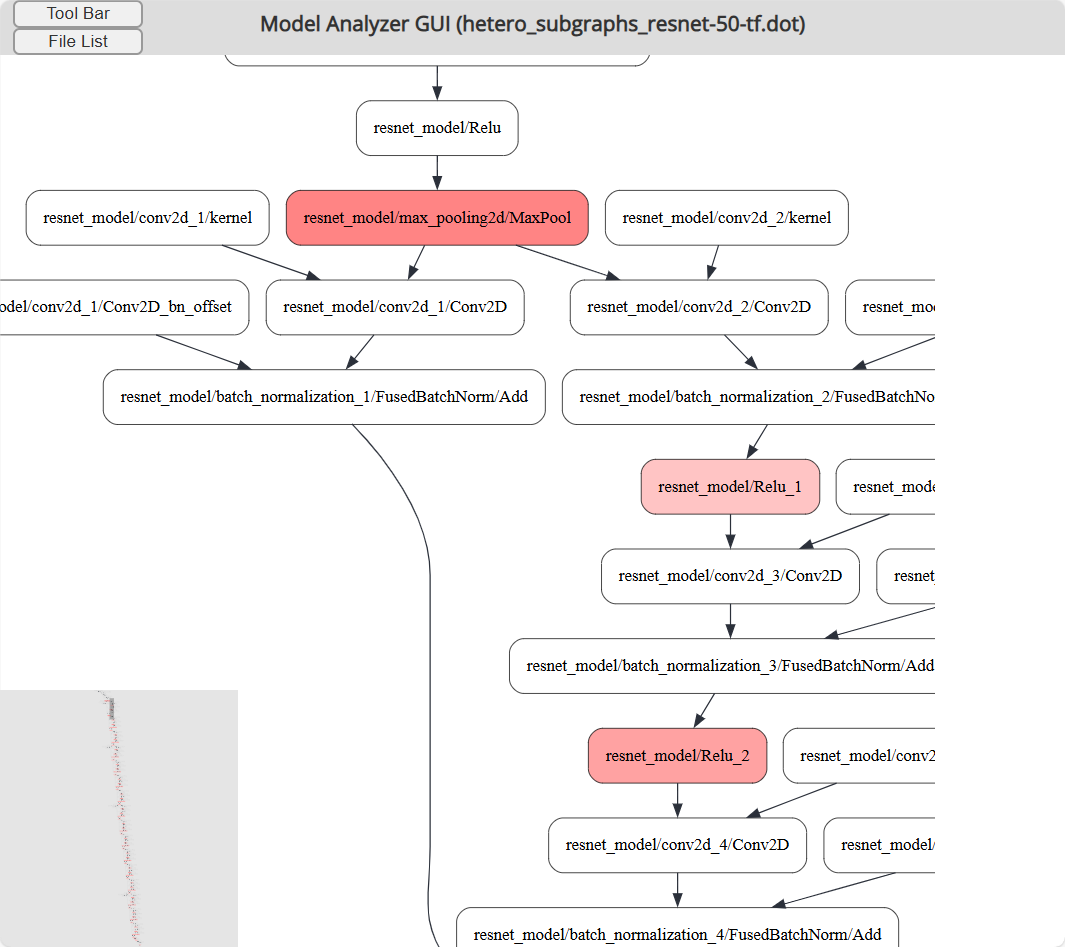
Clicking on node in the graph shows additional information about the node in a Details pane
- Main Window
Displays the DOT graph. You can zoom and pan the graph to view closeups of parts of your graph with zooming and panning.
You can also drag the graph around in the main window to view different parts of your graph.
You can zoom into the graph by scrolling your mouse wheel. Holding down the CTRL key while scrolling the mouse while zooms in and out quickly.
- Tool Bar button: Click Tool Bar and choose actions to open files or folders, hide constant nodes in the graph, highlight nodes with latency impacts, view help.
- File List button: Click File List to view the list of available .dot graph files to display. Click a file in the list to display the graph in the main window.
- Details Pane: Opens on the right when you click a node in a graph. The details pane shows detailed information about the selected nodes or layer, including attributes and performance metrics.
- Minimap: The lower-left corner shows a minimap view of the graph which indicates which part of the graph is visible in the main window. You can drag the box in the view to quickly navigate the entire graph.
Viewing Layer Details
Click on a node inside the Main Window to open Details Pane. The information for that layer will be displayed as follows:
- For hetero_subgraph .dot files the Details Pane shows information about the OpenVINO™ IR name for the layer, the OpenVINO™ nGraph Operation name, assigned device for non-constant layers; precision, shape, and value for constant layers.
- For unsupported_layer .dot files the Details Pane shows layer name, FPGA support, origin of the layer in the original OpenVINO™ IR, the type of the layer, and the reasons that the layer is assigned to CPU instead of FPGA.
Information displayed in the Details Pane is parsed from the DOT graph and matches with the manually converted image.
Viewing Layer Latencies
When you have a hetero_subgraph .dot file open, you can color-code the layers based on their execution latency by selecting Tool Bar > Layer Latency Heatmap. This color-coding provides you with a visual cue of performance-critical sections of your graph.
- --fanalyze-performance
- --festimate-per-layer-latencies
Constant nodes and nodes without reported layer latency appear in white.
Layers with reported latency values appear in shades of red with darker shades indicating a higher latency and lighter shades indicating a lower latency.
To see the latency report details for a node, click the node of interest to display the latency report in the Details Pane.
Per-layer latency information is not available when displaying unsupported_layer .dot files.
Hiding Constant Nodes
When you have a hetero_subgraph .dot file with many constant nodes (node in white color), you can reduce the visual clutter of seeing them in your graph by selecting Tool Bar > Hide Constant Node.
To display the constant node after hiding them, select Tool Bar > Hide Constant Node again.