A newer version of this document is available. Customers should click here to go to the newest version.
6.5.1.1. Remote Debugging With Intel® Simics® Simulation and RiscFree* IDE on the Same System
Using remote debugging capabilities with Intel® Simics® Simulation and RiscFree* IDE on the same system is useful when you have already started a simulation and want to start debugging without restarting the simulation.
This section describes the setup required in the RiscFree* IDE to set up a remote connection to an Intel® Simics® session running on the same system so that you can perform any debug activity.
- Complete the initial setup on the system that runs the Intel® Simics® simulation:
- Start an Intel® Simics® simulation session either using simics or simics-gui commands as described in Starting the Simulation.
- From the Intel® Simics® CLI console, run the start-eclipse-backend. This command enables Intel® Simics® simulator to accept a remote connection form a debugger. By default, it enables a TCP connection with the Simics name. The command returns the URL path for the connection.
#Intel Simics simulator CLI
simics> start-eclipse-backend
Starting TCF on:
 TCP:localhost:1534
 TCP:10.116.92.41:1534
In this example, the remote connection must use either the localhost:1534 path from the same host system or the 10.116.92.41:1534 path from a remote system.
- On the same system, start the RiscFree* IDE from your RiscFree* IDE installation directory (that is, do not use the simic-riscfree command):
#Linux terminal session
$ <riscfree_installdir>/RiscFree/RiscFree
You are prompted to choose (or create) a workspace. - Create a new debug configuration as follows:
- In the RiscFree* IDE, select Run > Debug Configuration.
- Double-click Simics Attach to Session.
When you create a new debug configuration, you see a window like the one shown in the figure that follows. By default, the name of the new configuration is New_configuration. You can rename the configuration. Under the Main tab, you must see the connection to the Intel® Simics® session created earlier.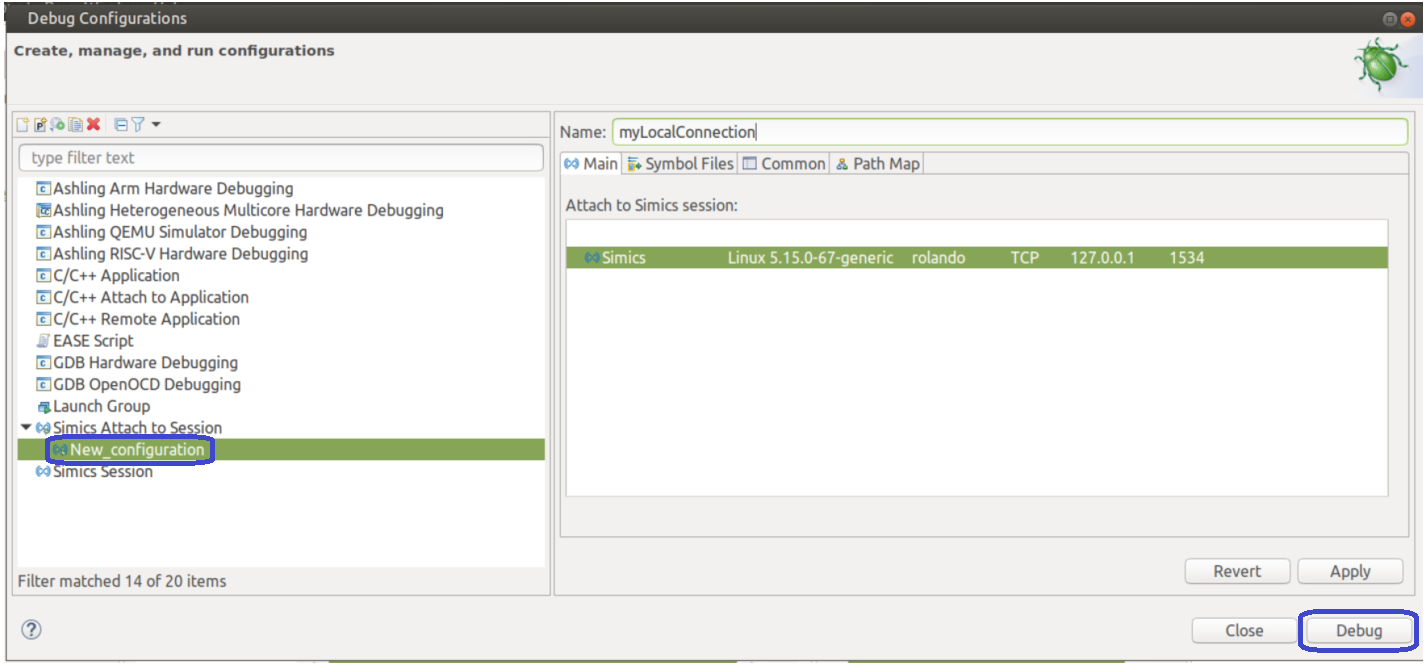
- In the Debug Configurations view, click Debug to start your debug session.
You might be prompted to switch to the Debug perspective.

In the Debug perspective, you can control your Intel® Simics® simulation through the RiscFree* IDE. After the debug session starts, you can perform typical debugging operation such as setting breakpoints. You can also progress through the simulation directly from the RiscFree* IDE.