Intel® Quartus® Prime Pro Edition User Guide: Programmer
A newer version of this document is available. Customers should click here to go to the newest version.
2.4.1. JTAG Chain Debugger Tool
Access the tool by clicking Tools > JTAG Chain Debugger in the Intel® Quartus® Prime software.
- JTAG Chain Integrity tab
- JTAG Chain Debugging tab
- Device chain pane
- Tap state pane
- Session log pane
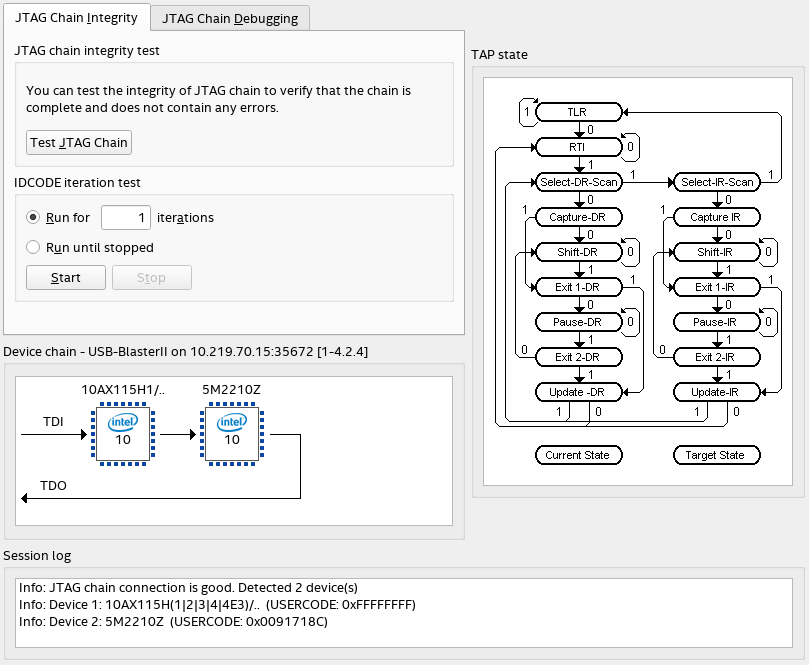
The tool also allows you to shift in JTAG instructions and data through the JTAG interface, and step through the test access port (TAP) controller state machine for debugging purposes.
- In the JTAG Chain Debugger Tool GUI, select Edit > Hardware Setup.
- In the Hardware Settings tab of the Hardware Setup window, select a hardware device in the Currently selected hardware field.
If no hardware is available to select, add hardware by clicking Add Hardware.
Initially, the Device chain pane is empty. To populate the Device chain pane, right-click in the pane and select Test JTAG chain, or click Test JTAG Chain on the JTAG Chain Integrity tab.
When the Device chain pane is populated, you can activate one or all devices in the chain to run the test on the activated device or devices. To activate a device or all devices in the Device chain pane, the JTAG Chain Debugging tab must be selected.
Tests are run only on activated devices. Devices that are not activated are bypassed during testing.
- To save the log to replay later, right-click anywhere in the Session log pane and select Save Session Log.
- To clear the log, right-click anywhere in the Session log pane and select Clear Session Log.