Visible to Intel only — GUID: thq1624994053534
Ixiasoft
1.1. Generating Primary Device Programming Files
1.2. Generating Secondary Programming Files
1.3. Enabling Bitstream Security for Intel® Stratix® 10 and Intel® Agilex™ Devices
1.4. Enabling Bitstream Encryption or Compression for Intel® Arria® 10 and Intel® Cyclone® 10 GX Devices
1.5. Generating Programming Files for Partial Reconfiguration
1.6. Generating Programming Files for Intel® FPGA Devices with Hard Processor Systems
1.7. Scripting Support
1.8. Generating Programming Files Revision History
2.1. Intel® Quartus® Prime Programmer
2.2. Programming and Configuration Modes
2.3. Basic Device Configuration Steps
2.4. Specifying the Programming Hardware Setup
2.5. Programming with Flash Loaders
2.6. Verifying the Programming File Source with Project Hash
2.7. Using PR Bitstream Security Verification ( Intel® Stratix® 10 Designs)
2.8. Stand-Alone Programmer
2.9. Programmer Settings Reference
2.10. Scripting Support
2.11. Using the Intel® Quartus® Prime Programmer Revision History
2.9.1. Device & Pin Options Dialog Box
2.9.2. More Security Options Dialog Box
2.9.3. Output Files Tab Settings (Programming File Generator)
2.9.4. Input Files Tab Settings (Programming File Generator)
2.9.5. Bitstream Co-Signing Security Settings (Programming File Generator)
2.9.6. Configuration Device Tab Settings
2.9.7. Add Partition Dialog Box (Programming File Generator)
2.9.8. Add Filesystem Dialog Box (Programming File Generator)
2.9.9. Convert Programming File Dialog Box
2.9.10. Compression and Encryption Settings (Convert Programming File)
2.9.11. SOF Data Properties Dialog Box (Convert Programming File)
2.9.12. Select Devices (Flash Loader) Dialog Box
Visible to Intel only — GUID: thq1624994053534
Ixiasoft
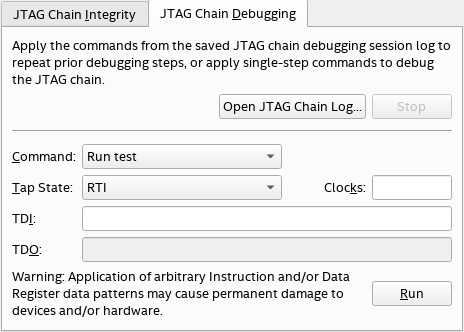
2.4.1.2. JTAG Chain Debugging Tab
Use the JTAG Chain Debugging tab to debug your JTAG chain by running commands to step through the state of the JTAG TAP controller. You can also repeat the commands from a previous session.
Figure 35. JTAG Chain Debugging Tab


When the JTAG Chain Debugging tab is active, you can use the Device chain pane to activate either a single device or all available devices:
- To activate a single device, click a device in the Device chain pane to select it and then right-click the device and select Activate selected device.
- To activate all available devices, right-click the the Device chain pane background and select Activate all devices.
If the the Device chain pane is empty, populate the Device chain pane by right-clicking in the pane and selecting Test JTAG chain. You can also click Test JTAG Chain on the JTAG Chain Integrity tab.
| Task | Description |
|---|---|
| Playback the debugging sequence | Apply the commands from a saved JTAG debugging session log to repeat prior debugging steps:
|
| Manually shift the JTAG sequence | Apply single-step commands:
|