Developer Guide for Intel® SDK for OpenCL™ Applications 2017
A newer version of this document is available. Customers should click here to go to the newest version.
Host Profiling
The Host Profiling page provides data that can help you optimize your host-side code.
This section includes the following reports:
- API Calls
- Memory Commands
- OpenCL Objects
API Call Report
The API call report lists statistics of calls made to the OpenCL API, including the number of times the API call was called, the number of errors returned, and statistics on the elapsed time each API call took while executing
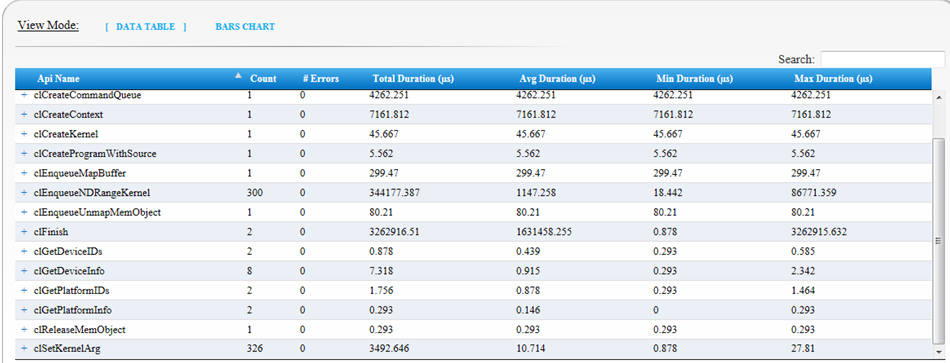
Click the + button on the left of any API name to expand and show additional information on this API, including the error code, input arguments and timing data of each call to this API during program execution.
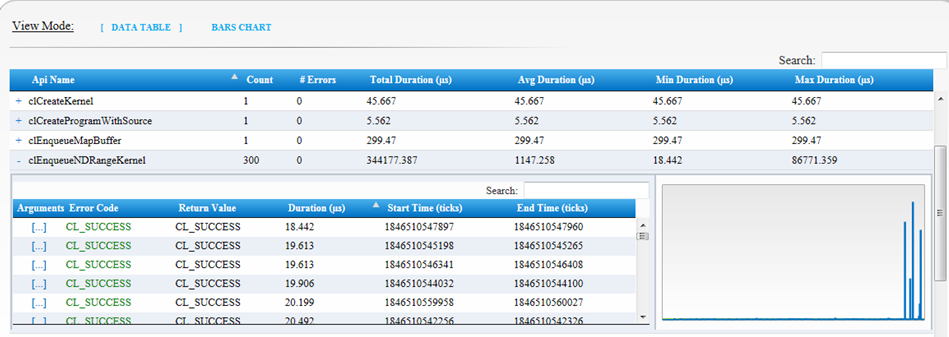
To see the entire list of arguments for each API call press "[..]" and the arguments column:
Memory Commands
The Memory Commands report lists statistics of calls made to the OpenCL program memory commands, including the number of times the memory commands were called, the number of times errors were returned, and statistics on the elapsed time each memory command call took while executing.
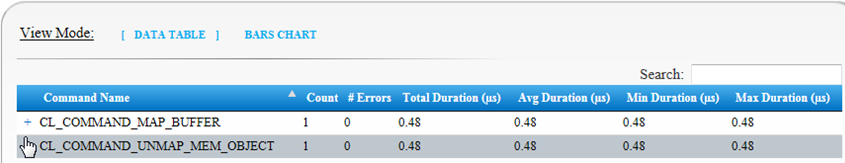
Click the + button on the left of any memory command name to expand its row. The expanded area presents additional information, including the return value, memory objects and timing data, of each call of this memory command occurred during the program execution.
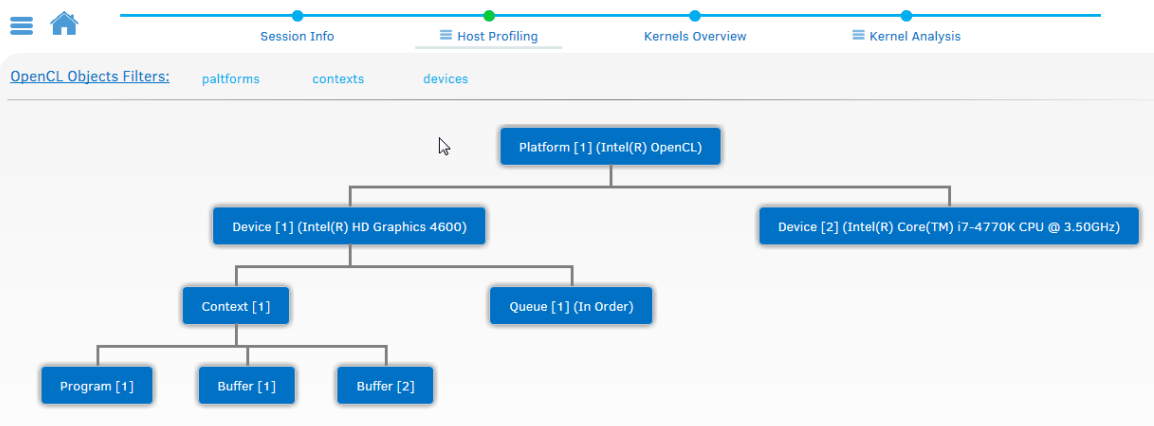
OpenCL Objects
The OpenCL Objects report presents all OpenCL objects that were created during the application run, shown as an hierarchical tree.
You can use the platform, context and devices menus to hide some branches of the tree.