Developer Guide for Intel® SDK for OpenCL™ Applications 2017
ID
773042
Date
10/22/2018
Public
A newer version of this document is available. Customers should click here to go to the newest version.
Legal Information
Getting Help and Support
Introducing the Intel® SDK for OpenCL™ Applications
What's New in This Release
Which Version of the Intel® SDK for OpenCL™ Applications Should I Use?
Intel® Code Builder for OpenCL™ API Plug-in for Microsoft Visual Studio*
Intel® Code Builder for OpenCL™ API Plug-in for Eclipse*
Debugging OpenCL™ Kernels on GPU
Intel® SDK for OpenCL™ Applications Standalone Version
OpenCL™ 2.1 Development Environment
Intel® FPGA Emulation Platform for OpenCL™ Getting Started Guide
Troubleshooting Intel® SDK for OpenCL™ Applications Issues
Configuring Microsoft Visual Studio* IDE
Converting an Existing Project into an OpenCL™ Project
OpenCL™ New Project Wizard
Building an OpenCL™ Project
Using OpenCL™ Build Properties
Selecting a Target OpenCL™ Device
Generating and Viewing Assembly Code
Generating and Viewing LLVM Code
Generating Intermediate Program Binaries with Intel® Code Builder for OpenCL™ API Plug-in
Configuring OpenCL™ Build Options
Debugging OpenCL™ Kernels
This topic demonstrates how to use the Intel® SDK for OpenCL™ Applications - GPU Kernel Debugger to debug an OpenCL™ sample application on a Microsoft Windows* OS.
To debug your OpenCL kernels on GPU using Intel SDK for OpenCL Applications - GPU Kernel Debugger on a Microsoft Windows* OS, perform the following steps:
- On the target machine, launch the Remote Debugger:
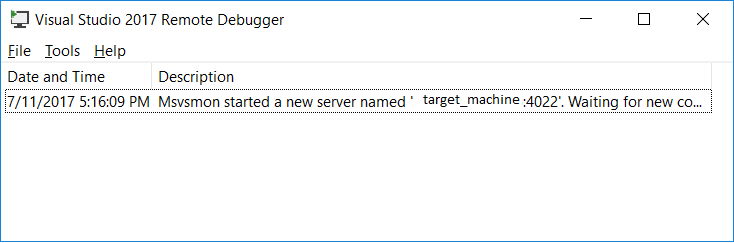 NOTE:Make sure that the version of the Visual Studio Remote Debugger you run on the target machine, matches the version of the Visual Studio IDE you use on the host machine. For example, if you are using Visual Studio 2015 on the host, you should use Visual Studio 2015 Remote Debugger on the target machine.
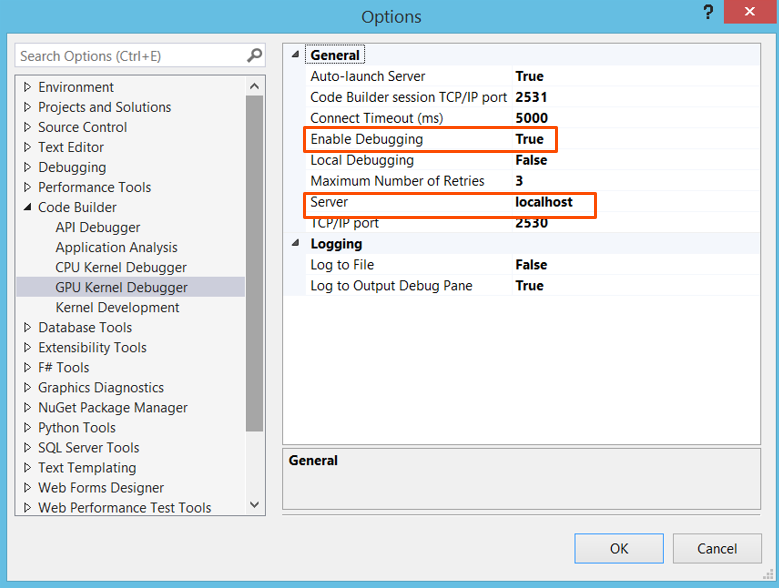
 - On the host machine, start Microsoft Visual Studio* 2015/2017, go to Tools > Options > Code Builder > GPU Kernel Debugger, set Enable Debugging to True and change the Server field to the name of the target machine (localhost in this example):
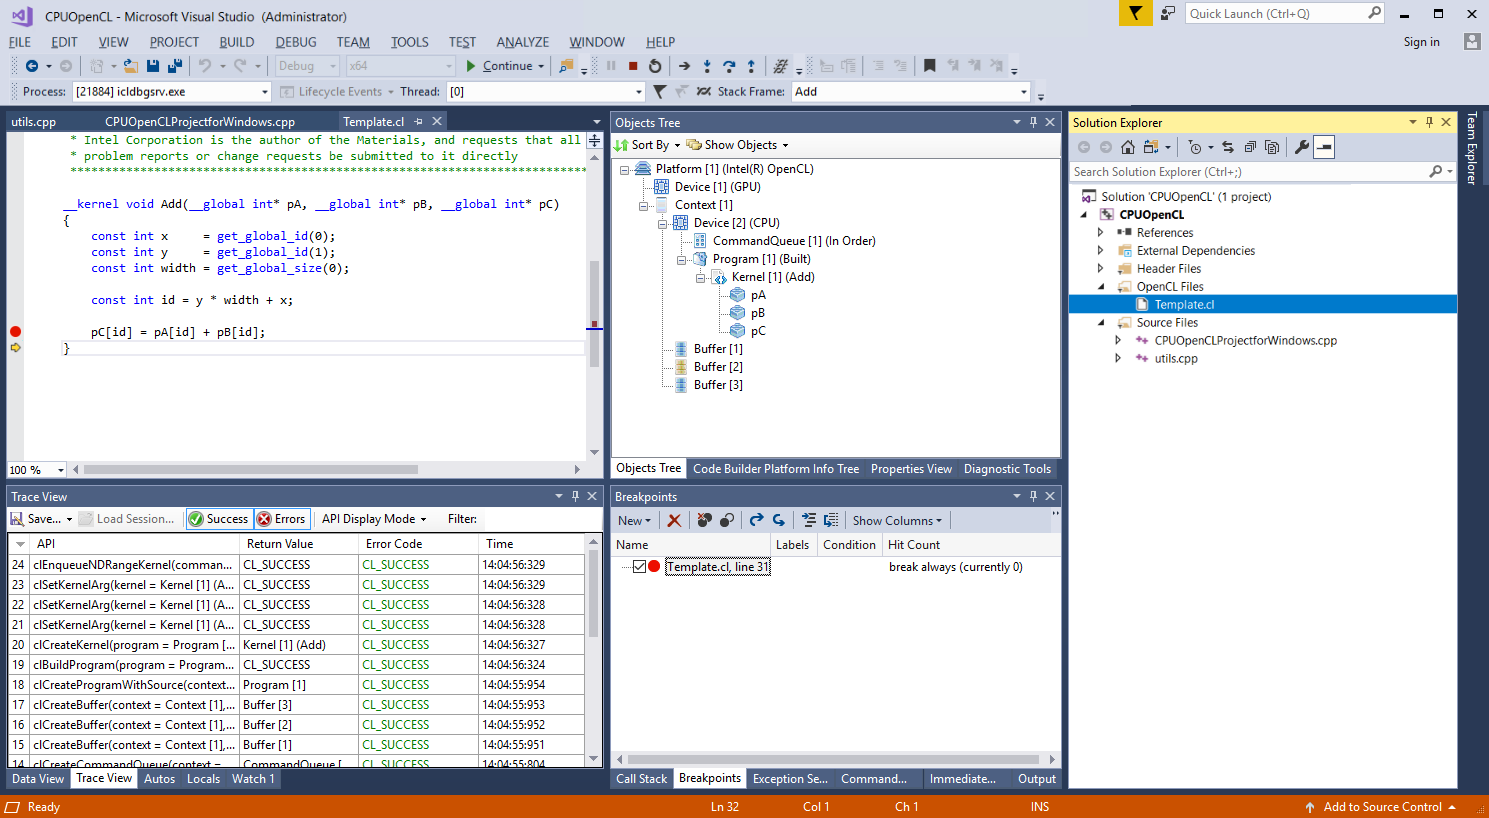
- Add the OpenCL kernel file to your project (if it is not part of the project yet), and set breakpoints where needed.
- Build your project and copy the executable and .cl files to the working directory on your target machine.
- Configure your project for remote C++ Debugging:
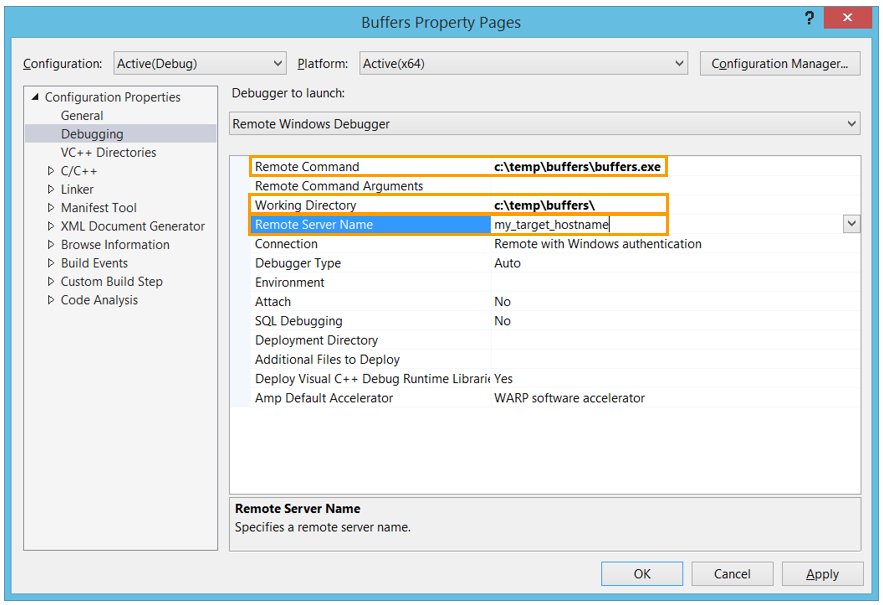
- Right click on your project, choose Properties, open Configuration Properties > Debugging and select Remote Windows Debugger in the Debugger to launch list:
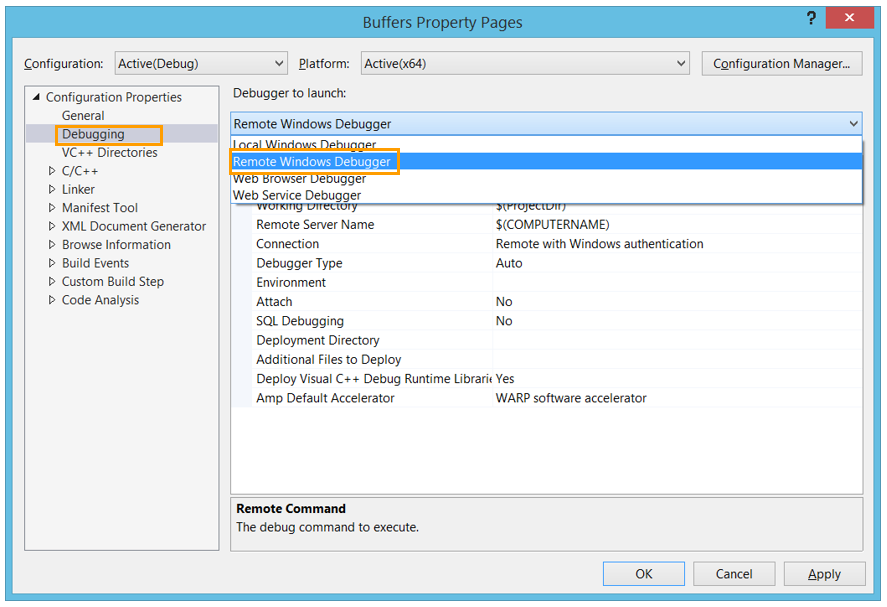
- Set Remote Command to the full path to your executable on the target machine.
- Set Working Directory to the directory where the binary file is located.
- Set Remote Server name to be the host name of your target machine.
- Click OK:
- Right click on your project, choose Properties, open Configuration Properties > Debugging and select Remote Windows Debugger in the Debugger to launch list:
- After the dialog is closed, click on Remote Windows Debugger, or press F5:

- If you configured the project properly, the debugger stops execution at the breakpoints you have set: