Developer Guide for Intel® SDK for OpenCL™ Applications 2017
ID
773042
Date
10/22/2018
Public
A newer version of this document is available. Customers should click here to go to the newest version.
Legal Information
Getting Help and Support
Introducing the Intel® SDK for OpenCL™ Applications
What's New in This Release
Which Version of the Intel® SDK for OpenCL™ Applications Should I Use?
Intel® Code Builder for OpenCL™ API Plug-in for Microsoft Visual Studio*
Intel® Code Builder for OpenCL™ API Plug-in for Eclipse*
Debugging OpenCL™ Kernels on GPU
Intel® SDK for OpenCL™ Applications Standalone Version
OpenCL™ 2.1 Development Environment
Intel® FPGA Emulation Platform for OpenCL™ Getting Started Guide
Troubleshooting Intel® SDK for OpenCL™ Applications Issues
Configuring Microsoft Visual Studio* IDE
Converting an Existing Project into an OpenCL™ Project
OpenCL™ New Project Wizard
Building an OpenCL™ Project
Using OpenCL™ Build Properties
Selecting a Target OpenCL™ Device
Generating and Viewing Assembly Code
Generating and Viewing LLVM Code
Generating Intermediate Program Binaries with Intel® Code Builder for OpenCL™ API Plug-in
Configuring OpenCL™ Build Options
Analysis Results
After you finish running the application, the new analysis session that you created appears in the Analyze Sessions Explorer window and a results view appears in Visual Studio* main area.
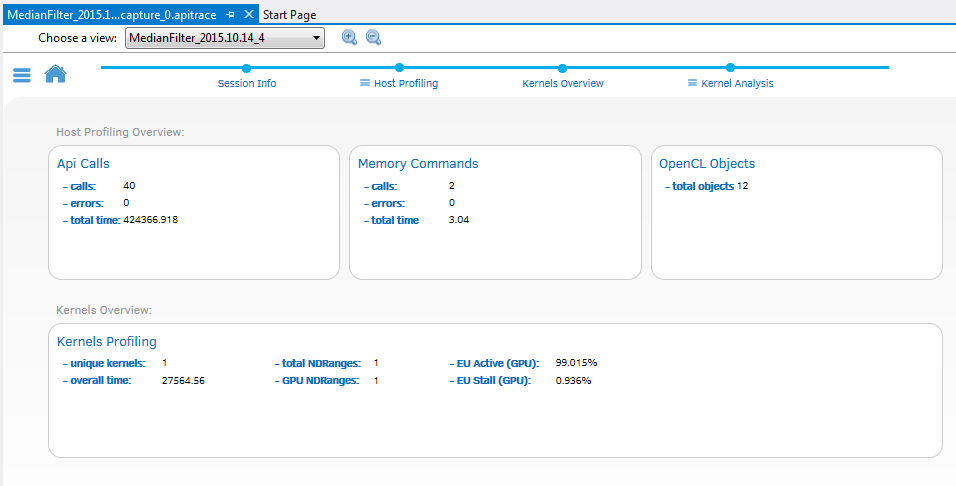
The analysis result view contains an analysis home page and an analysis progress bar with several steps to review the analysis results.
In the home page  of the analysis view you can find an overview of the host and kernel profiling results. You can click on each one of the sections on this page to navigate to the relevant report or you can follow the analysis progress bar steps: