Tutorial: Analyze Common Performance Bottlenecks using Intel VTune Profiler in a C++ Sample Application - Windows* OS
Run Performance Snapshot Analysis
In this part of the tutorial, you open the Matrix sample project and run the Performance Snapshot analysis of Intel® VTune™ Profiler to identify the main problem areas.
Performance Snapshot Analysis
For most software developers, the goal of performance optimization is to get the highest possible performance gain with the least possible investment of time and effort.
The Performance Snapshot analysis type helps you achieve this goal by highlighting the main problem areas in your application and providing metrics to estimate their severity. This enables you to focus on the most acute problems, solving which can yield the highest performance gain. This analysis type also offers other analysis types for deeper investigation into each performance problem.
Open Matrix Sample Project
The first step towards analyzing an application in VTune Profiler is to create a project. A project is a container that holds analysis target configuration and data collection results.
VTune Profiler provides a sample matrix project pre-configured to work with the pre-built matrix sample application.
Begin by opening the pre-configured matrix project:
Launch the VTune Profiler GUI:
Run the following script to set the appropriate environment variables:
<install-dir>\env\vars.bat
For VTune Profiler, the default <install-dir> is:
[Program Files]\Intel\oneAPI\vtune\<version>
Locate the VTune Profiler icon in the Start menu and start VTune Profiler.
NOTE:You may need to run VTune Profiler as Administrator to use certain analysis types.
The VTune Profiler welcome screen is displayed after the product launches.
The sample (matrix) project should already be open in the Project Navigator. If so, no further action is required.
If the sample (matrix) project is not available from the Project Navigator, open the project manually:
Click the
 Menu button and select Open > Project... to open an existing project.
 Browse to the matrix project on your local machine and click Open.
By default, it is located in this directory:
[Users]\<user>\Documents\VTune\Projects\sample (matrix)
VTune Profiler opens the matrix project in the Project Navigator.
This tutorial uses the pre-built matrix sample application. When you analyze your own application, make sure to build it in the Release mode with full optimizations and establish a performance baseline before running a full analysis. For more information on preparing a Windows* target, see the Windows Targets section of the User Guide.
To make sure that the performance data is accurate and repeatable, it is recommended to run the analysis while the system is running a minimal amount of other software.
Run Performance Snapshot Analysis
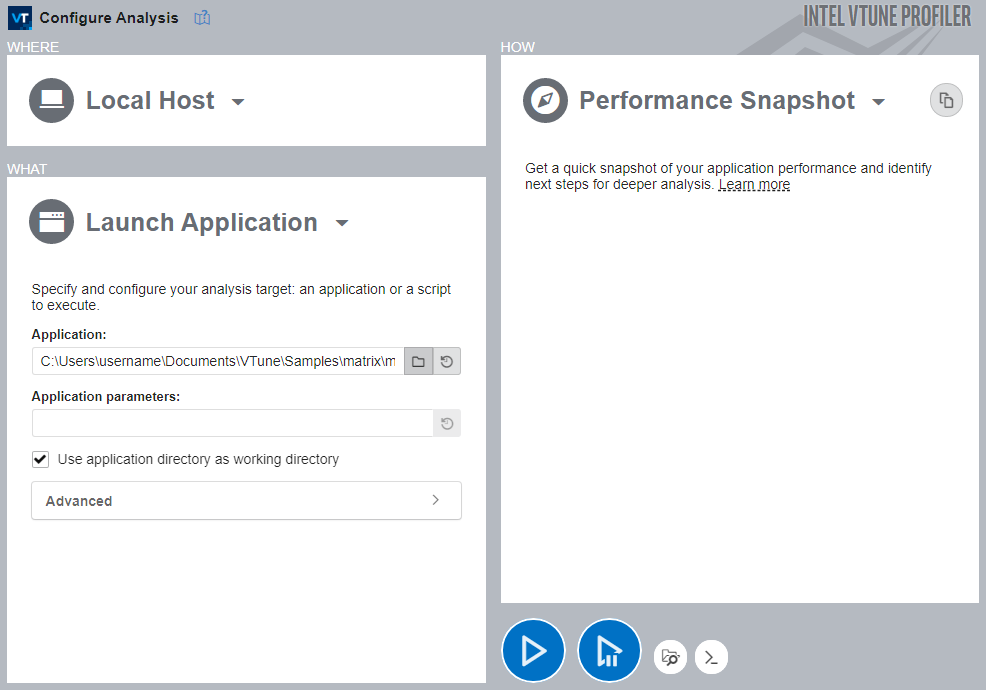
To start the Performance Snapshot analysis for the matrix sample application:
Click the Configure Analysis button to begin a new analysis. The default analysis is pre-configured for the Performance Snapshot analysis to profile the matrix application on the local system.
Click the Start button to run the analysis.
VTune Profiler the matrix application that calculates multiplication of large matrices before exiting. VTune Profiler finalizes the collected results and opens the Summary viewpoint of the Performance Snapshot analysis.
This tutorial explains how to run an analysis from the VTune Profiler graphical user interface (GUI). You can also use the VTune Profiler command-line interface (vtune command) to run an analysis. A simple way to get the appropriate command syntax is by clicking the Command Line button at the bottom of the window. For more details, check the Command Line Interface chapter of the VTune Profiler User Guide.
Next step: Interpret Performance Snapshot Analysis.