Tutorial: Analyze Common Performance Bottlenecks using Intel VTune Profiler in a C++ Sample Application - Windows* OS
Enable Platform-Appropriate Vectorization
At this point in the Tutorial, you enable the use of vector registers appropriate for the platform and check vectorization efficiency.
For an in-depth exploration of vectorization, try Intel® Advisor. It is a performance analysis tool that offers deep insights into vectorization opportunities, vectorization efficiency, dependencies, and much more.
In this section, you will be instructed to use the /QxHost option compile the application with the best instruction set extension out of the ones that your processor performing the compilation supports. To generate multiple code paths that enable your software to run on a variety of microarchitectures, see the ax, Qax option of the Intel® oneAPI DPC++/C++ Compiler.
Enable Full Vectorization
To enable the use of a vector instruction set appropriate for the platform, one possible way is to instruct the compiler to use the same vector extension as the best one available in the processor performing the compilation.
Follow these steps to enable platform-appropriate vectorization using Visual Studio*:
In the Solution Explorer pane, right-click the matrix project and select Properties.
Navigate to the C/C++ > Code Generation [Intel C++] menu.
Set the Intel Processor-Specific Optimization option to Same as the host processor performing the compilation (/QxHost) to instruct the compiler to use the best instruction set extension available on the processor that is performing the compilation.
Save changes to the Properties.
Build the application.
Check Vectorization with Performance Snapshot
Run the Performance Snapshot analysis to ensure that the application is properly vectorized.
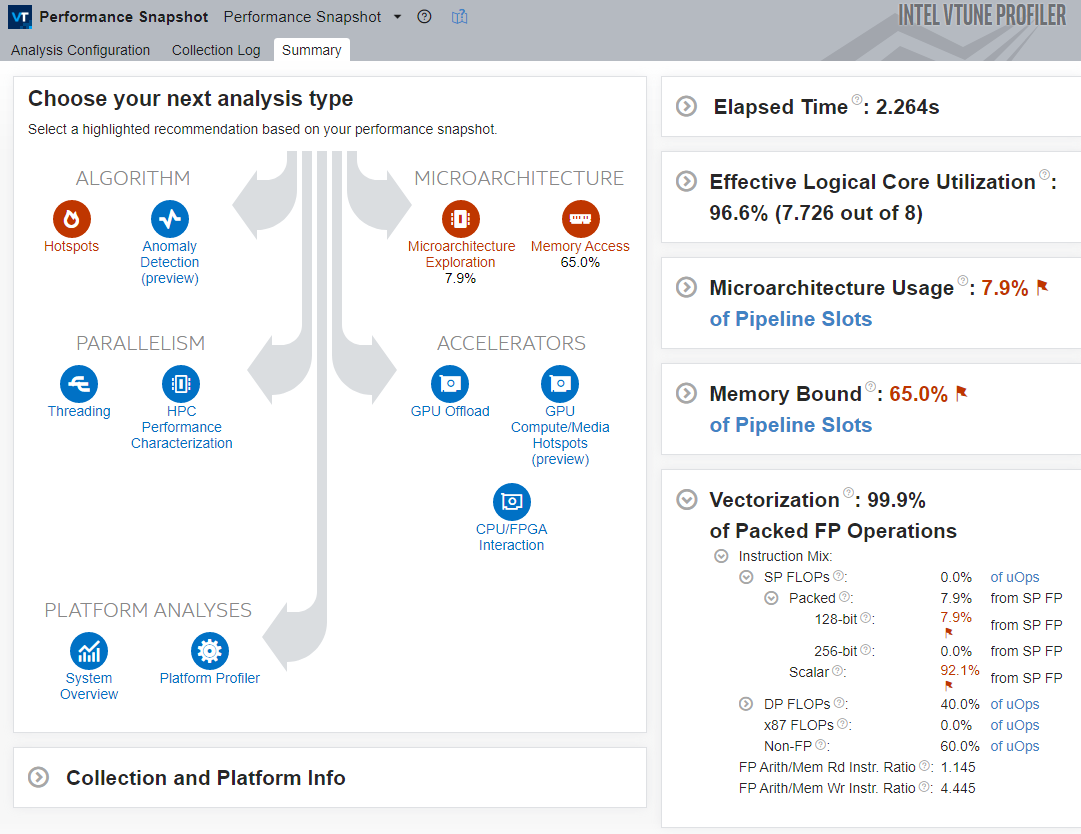
Once the application exits, Intel® VTune™ Profiler opens the Performance Snapshot Summary window.

Observe these main indicators:
The Elapsed Time for the application has slightly decreased.
The Vectorization metric equals to 99.9%, so the code was fully vectorized.
A total 100.0% of Packed DP FLOP instructions were executed using the 256-bit registers. Therefore, even without running the HPC Performance Characterization analysis, the conclusion is that the AVX2 vector extensions were fully utilized.
VTune Profiler highlights the Microarchitecture Usage metric and offers to use the Microarchitecture Exploration analysis to understand how exactly the application is underutilizing the microarchitecture.
Next step: Analyze Microarchitecture Usage.