Ethernet Link Inspector User Guide for Intel® Stratix® 10 Devices
ID
683367
Date
7/01/2019
Public
2.2.2. Running the Link Analysis
Perform the following steps to launch the Link Analysis module.
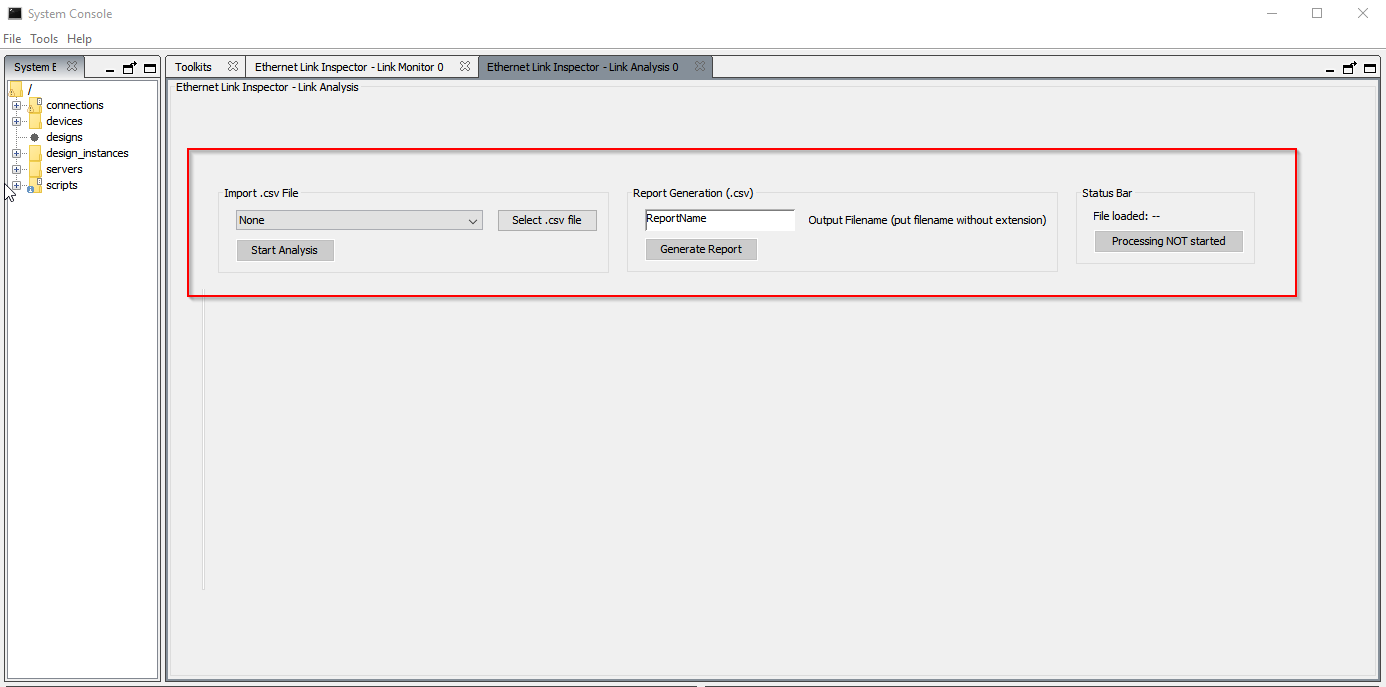
Example Link Analysis Tab
- In the Intel® Quartus® Prime Pro Edition software, select Tools > System Debugging Tools > System Console to launch the system console.
- In the system console, click the Launch button under the Ethernet Link Inspector - Link Analysis section to run the Link Analysis module. The Ethernet Link Inspector - Link Analysis tab appears.
Note: You can open multiple instances of the Link Analysis module simultaneously for different IPs.
- In the Ethernet Link Inspector - Link Analysis tab, select the target IP core from the drop-down box.
- Click the Select .csv file button to import the Signal Tap database (.csv) file. Refer to the Creating and Capturing Signal Tap Database and Exporting as CSV File section in this user guide to create the .csv file. In the Status Bar, make sure the directory to the imported database is correct.
- Click the Start Analysis button.
Note: If you want the summary of the Ethernet link capture without using the Link Analysis, enter a report name and click Generate Report button to create a report (.csv) file. This feature is supported only for 10GBASE-KR PHY Intel® Stratix® 10 FPGA IP and Intel® Stratix® 10 Low Latency 40G Ethernet Intel® FPGA IP.
You can now use the Link Analysis to analyze the Signal Tap database.