Ethernet Link Inspector User Guide for Intel® Stratix® 10 Devices
ID
683367
Date
7/01/2019
Public
2.2.1. Running the Link Monitor
Perform the following steps to launch the Link Monitor module.
Example Link Monitor Tab
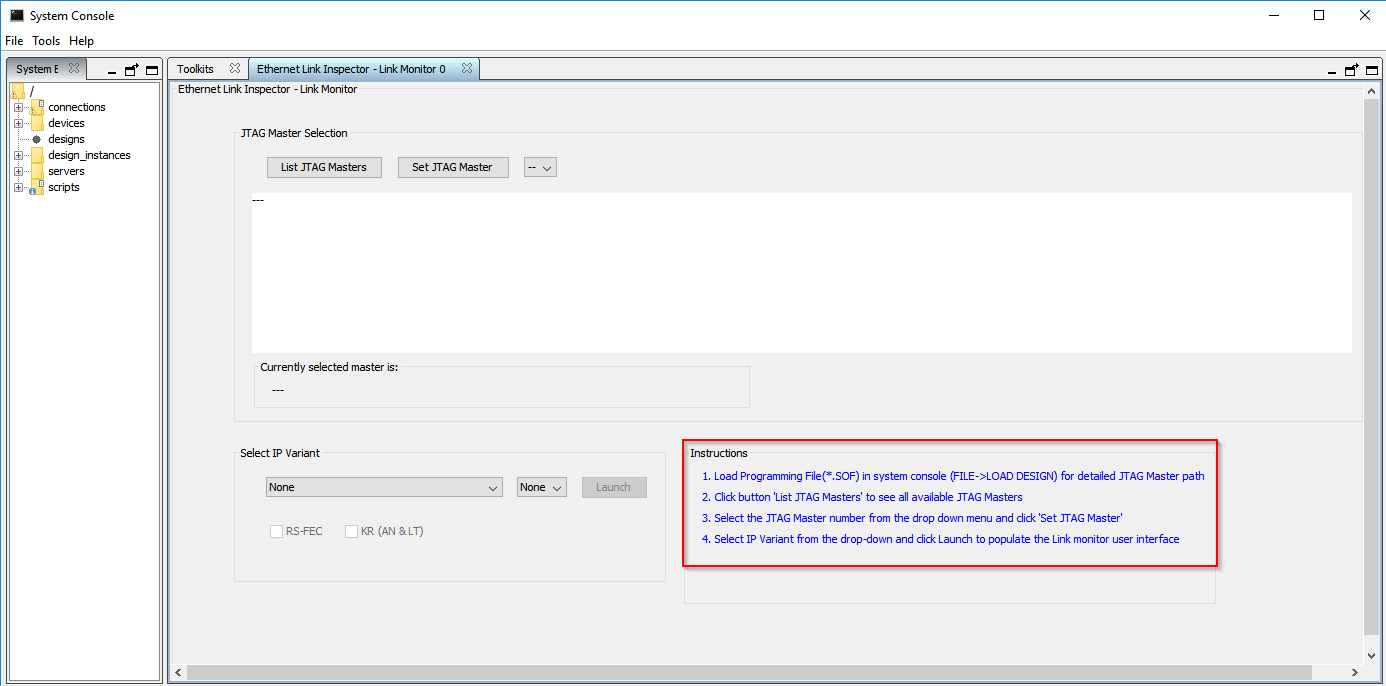
- In the Intel® Quartus® Prime Pro Edition software, select Tools > System Debugging Tools > System Console to launch the system console.
- In the system console, click the Launch button under the Ethernet Link Inspector - Link Monitor section to run the Link Monitor module. The Ethernet Link Inspector - Link Monitor tab appears.
Note: You can open multiple instances of the Link Monitor module simultaneously for different IPs.
- In the Ethernet Link Inspector - Link Monitor tab, follow these steps to set the correct JTAG to Avalon® Master path:
- Load the Programming File (*.sof) in System Console by clicking File > Load Design for the detailed JTAG to Avalon® Master path.
- Select List JTAG Masters to see all available JTAG to Avalon® Master paths.
- Select a JTAG to Avalon® Master path number from the drop-down box and click Set JTAG Master.
Note: The instance name of the JTAG to Avalon® Master path is displayed along with the text FULL_HPATH (marked by the blue box in the figure below). Select the JTAG to Avalon® Master path number that has the instance name of the JTAG to Avalon® Master path connected to the Ethernet IP.Figure 1. Example JTAG Master Selection Panel
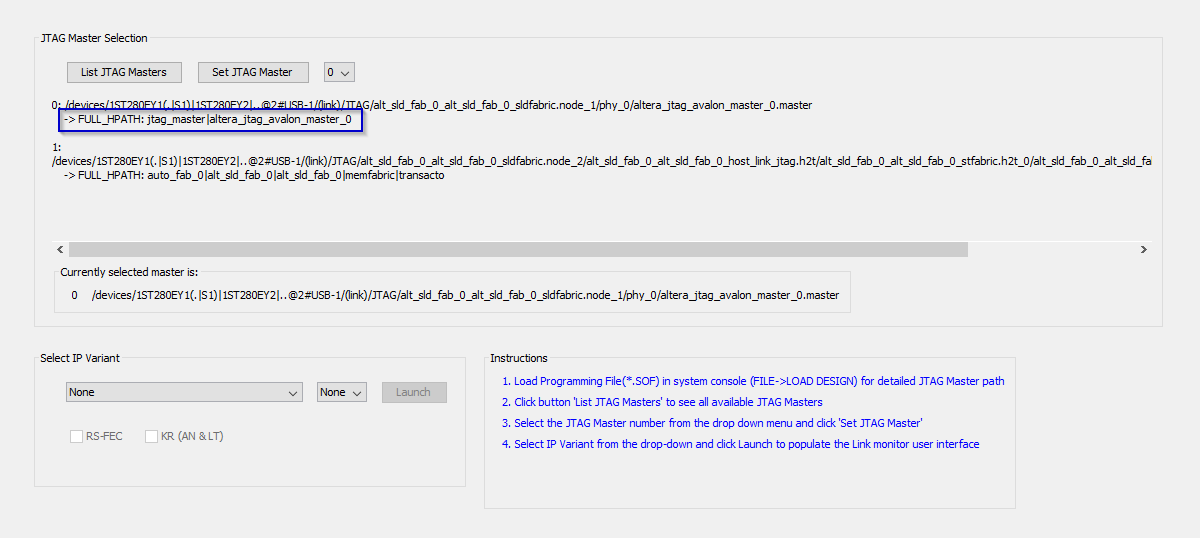
- From the Select IP Variant drop-down list, select an IP Variant and click Launch to populate the user interface of the Link Monitor.