3.1. lperf3 Traffic Test Result
The following analysis captures the performance of Intel® FPGA PAC N3000 and XXV710 card, both simultaneously acting as a network interface card of PTP slaves (T-TSC) to the Calnex Paragon NEO Grandmaster through the T-BC Cisco switch.
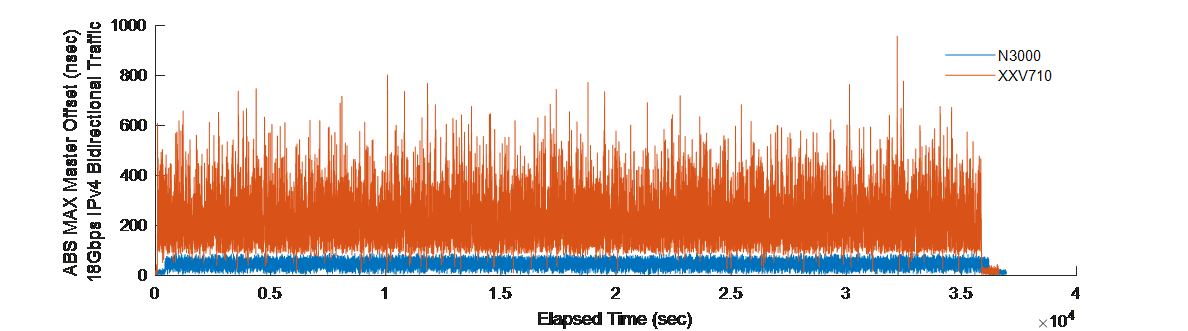
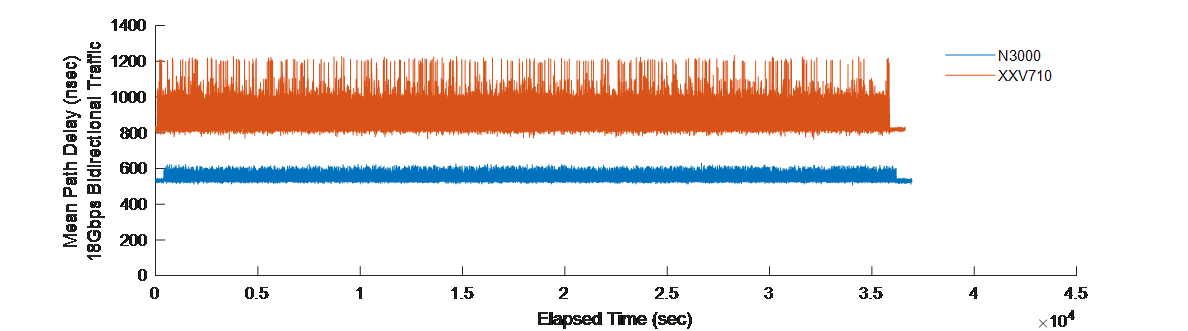
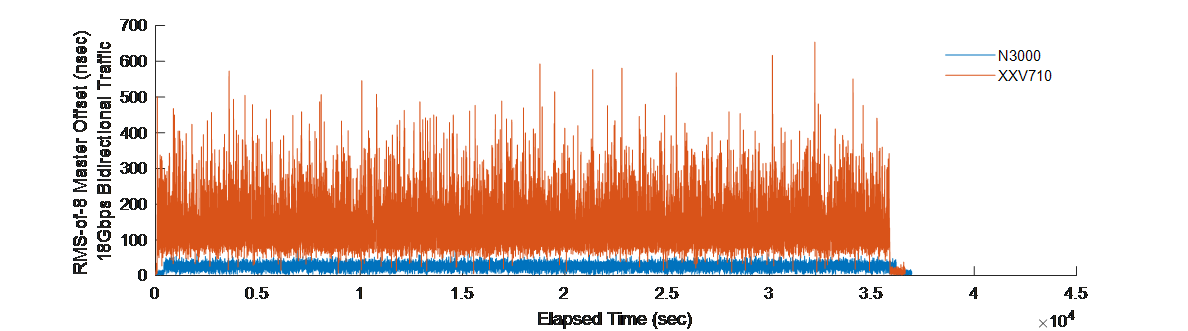
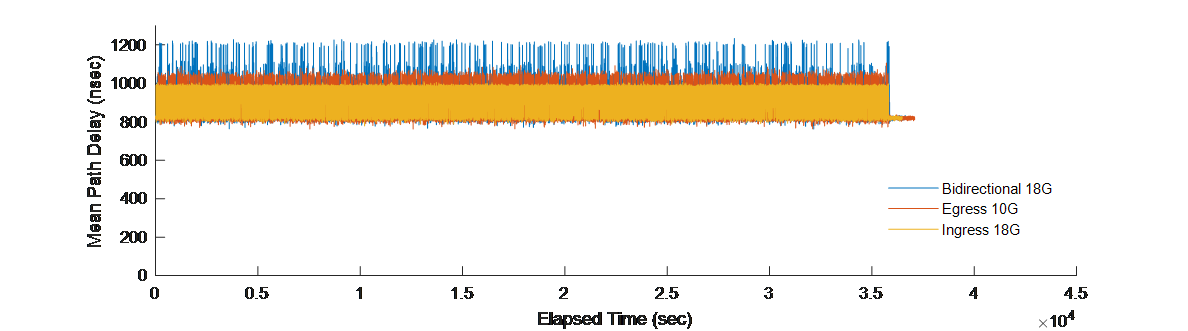
The following figures show magnitude of master offset and MPD over time for three different traffic tests using the Intel® FPGA PAC N3000 with T-TC and XXV710 card. In both the cards, bidirectional traffic has the largest effect on the PTP4l performance. The traffic test durations are 10 hours long. In the following figures, graph's tail marks a point on time where the traffic stops and the magnitude of PTP master offset goes down to its low levels, due to the idle channel.
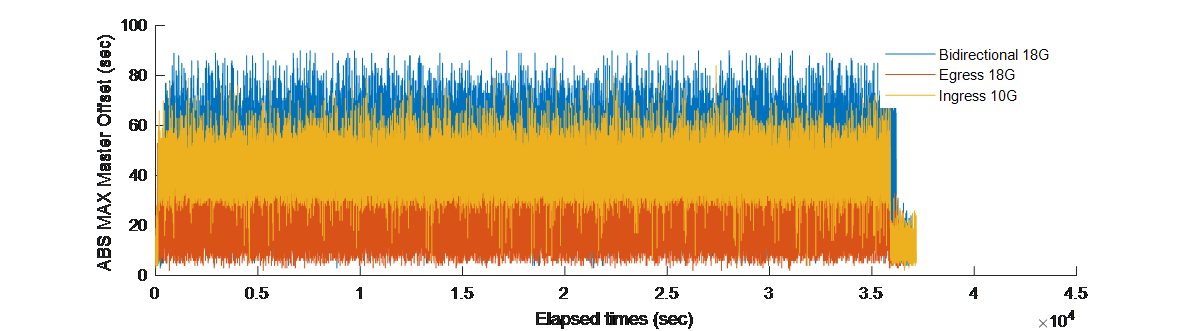
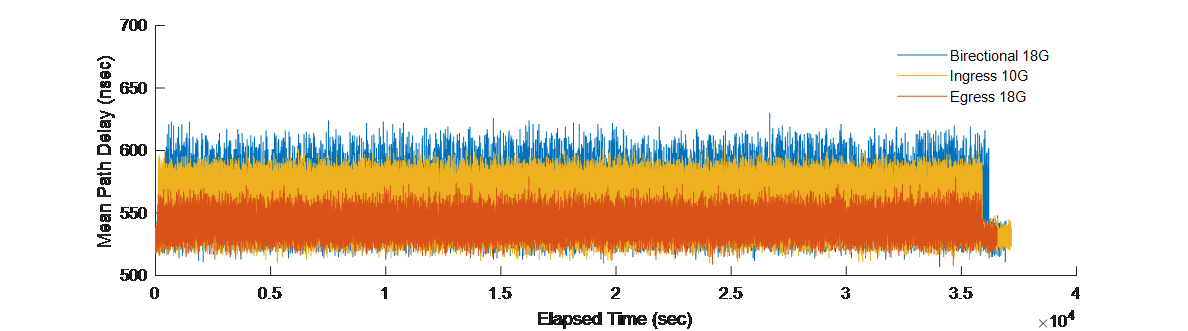
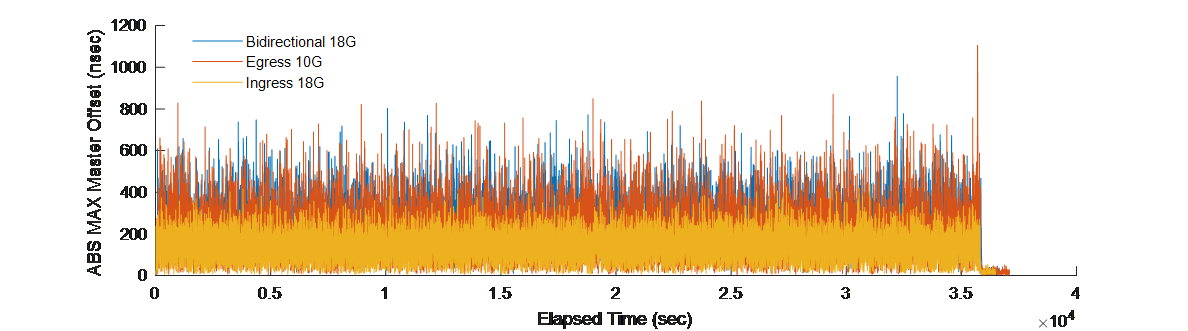
Regarding the Intel® FPGA PAC N3000 PTP performance, the worst-case master offset under any traffic condition is within 90 ns. While under the same bidirectional traffic conditions, the RMS of the Intel® FPGA PAC N3000 master offset is 5.6x better than the one of XXV710 card.
| Intel® FPGA PAC N3000 | XXV710 Card | |||||
|---|---|---|---|---|---|---|
| Ingress Traffic 10G |
Egress Traffic 18G |
Bidirectional Traffic 18G |
Ingress Traffic 18G |
Egress Traffic 10G |
Bidirectional Traffic 18G |
|
| RMS | 27.6 ns | 14.2 ns | 27.2 ns | 93.96 ns | 164.2 ns | 154.7 ns |
| StdDev (of abs(max) offset) |
9.8 ns | 8.7 ns | 14.6 ns | 61.2 ns | 123.8 ns | 100 ns |
| StdDev (of MPD) |
21.6 ns | 9.2 ns | 20.6 ns | 55.58 ns | 55.3 ns | 75.9 ns |
| Max offset | 84 ns | 62 ns | 90 ns | 474 ns | 1,106 ns | 958 ns |
Notably, the master offset of the Intel® FPGA PAC N3000 has lower standard deviation, at least 5x less than the XXV710 card, signifies that the PTP approximation of the Grandmaster clock is less sensitive to latency or noise variations under traffic in the Intel® FPGA PAC N3000.
When compared to the IXIA Traffic Test Result, the worst-case magnitude of the master offset with a T-TC enabled Intel® FPGA PAC N3000 appears higher. Besides the differences in network topology and channel bandwidths, this is due to the Intel® FPGA PAC N3000 being captured under a G.8275.1 PTP profile (16 Hz sync rate), while the sync message rate in this case is constrained at 8 packets per second.