A newer version of this document is available. Customers should click here to go to the newest version.
Use Advanced Profiling Mode
Use Advanced Profiling mode of Graphics Frame Analyzer to group events within a frame by bottleneck or state.
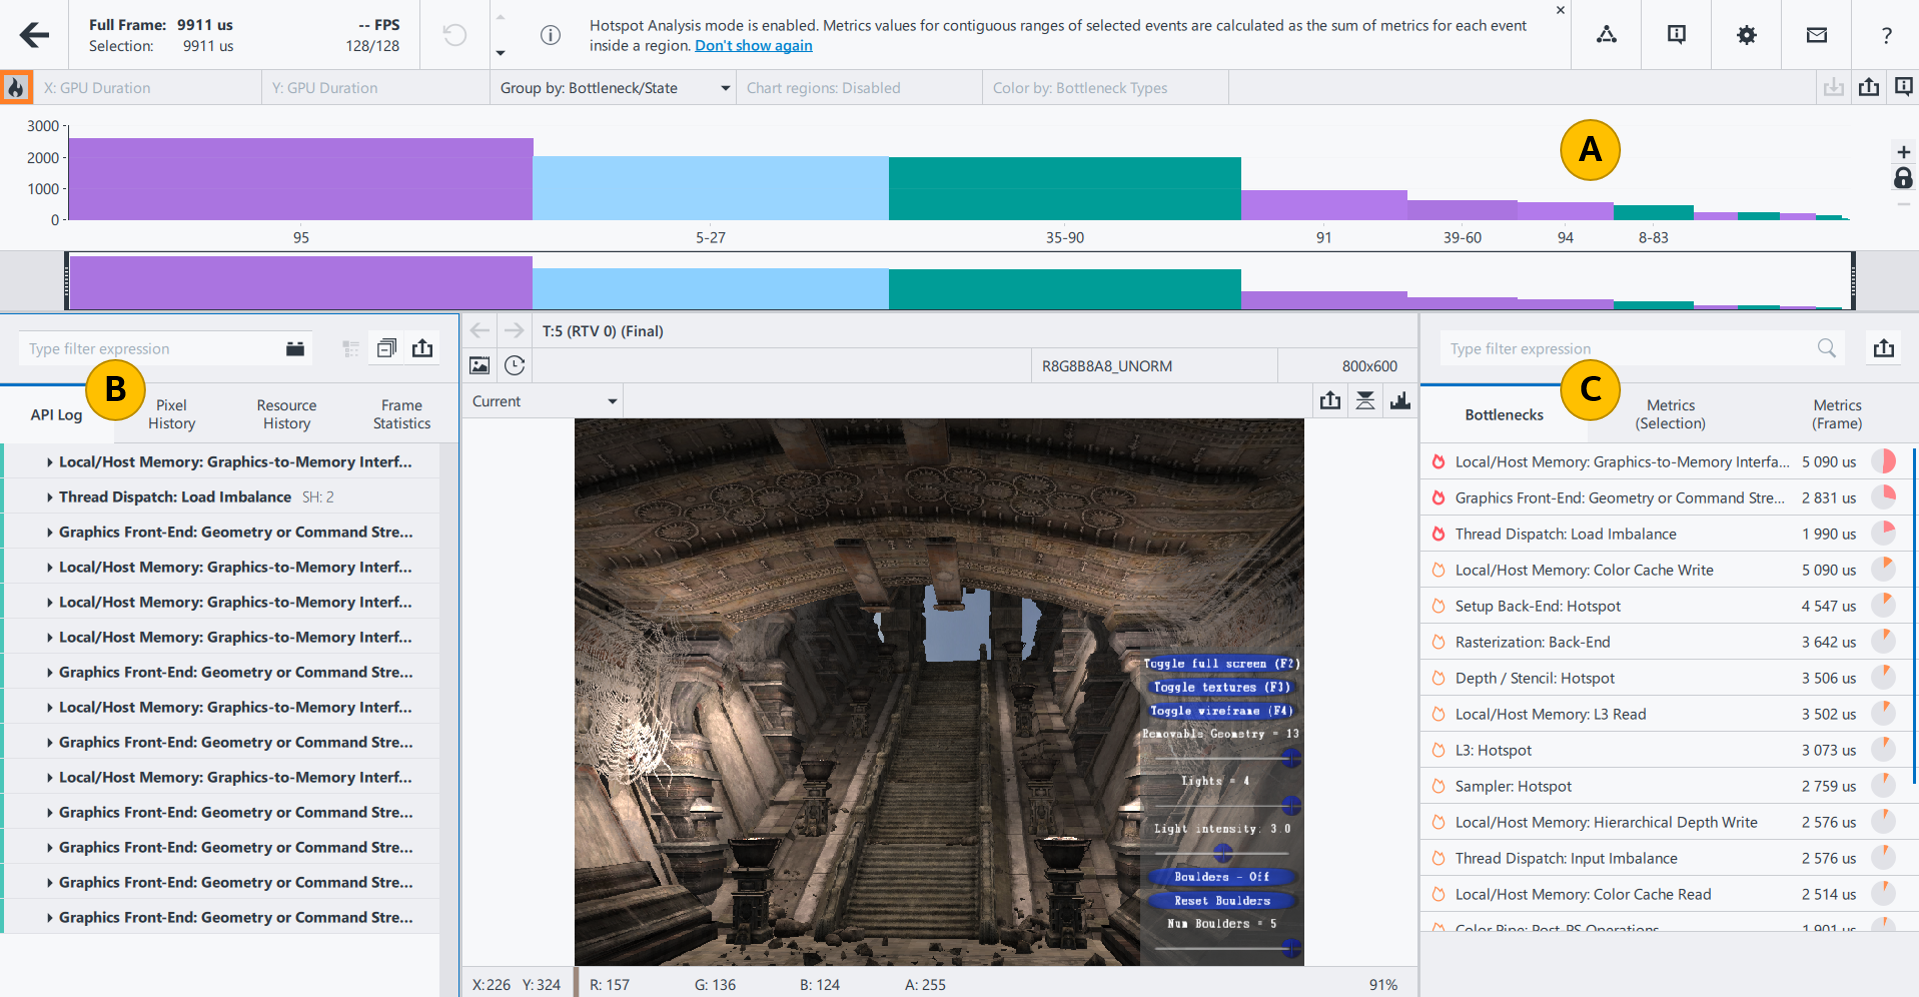
By default, the Bar Chart shows the bar chart in a time-based view. Advanced Profiling mode groups the events within a frame by bottleneck and/or state, where states are shader sets in DirectX* 11, pipeline state objects (PSO) in DirectX 12, and pipelines in Vulkan. By enabling Advanced Profiling mode, you can identify exactly which bottleneck or state is affecting the GPU most. Then you can explore bottlenecks in more detail: each grouping expands to reveal which events contribute to that specific bottleneck/state.
To indicate bottlenecks with Advanced Profiling mode:
Click the
 Advanced Profiling Mode button on the top left.
The API calls are grouped by bottlenecks and/or states in the Bar Chart (
 ) and API Log (
  ) panes. The first group of draw calls is the most impactful and time-consuming. In the Bar Chart, the X-Y axis is set to GPU Duration by GPU Duration, which allows the tallest and widest bars to represent the events that take up the most time on the GPU.
The Bottlenecks tab of the Metrics pane (
 ) presents color-coded bottlenecks. Red hot spot icons next to the bottleneck indicate main bottlenecks, and orange indicate secondary bottlenecks. Secondary bottlenecks are potential and may disappear once you resolve primary bottlenecks. On the right of the bottleneck name, you can see:
Total duration of all API calls contributing to this bottleneck, in microseconds.
Pie chart showing the percentage of time spent on API calls that have this bottleneck in relation to the time spent on all API calls with primary (red) or secondary (orange) bottlenecks.
(Optional) You can change the categorization used to determine hot spots by selecting any of the attributes in the Group By drop-down menu:

Bottleneck/State - groups events that share the same state and bottleneck.
Bottleneck - groups events that share the same bottleneck; shared states are used as sub-categories.
State - groups events that share the same states; the bottleneck is used as a sub-category.
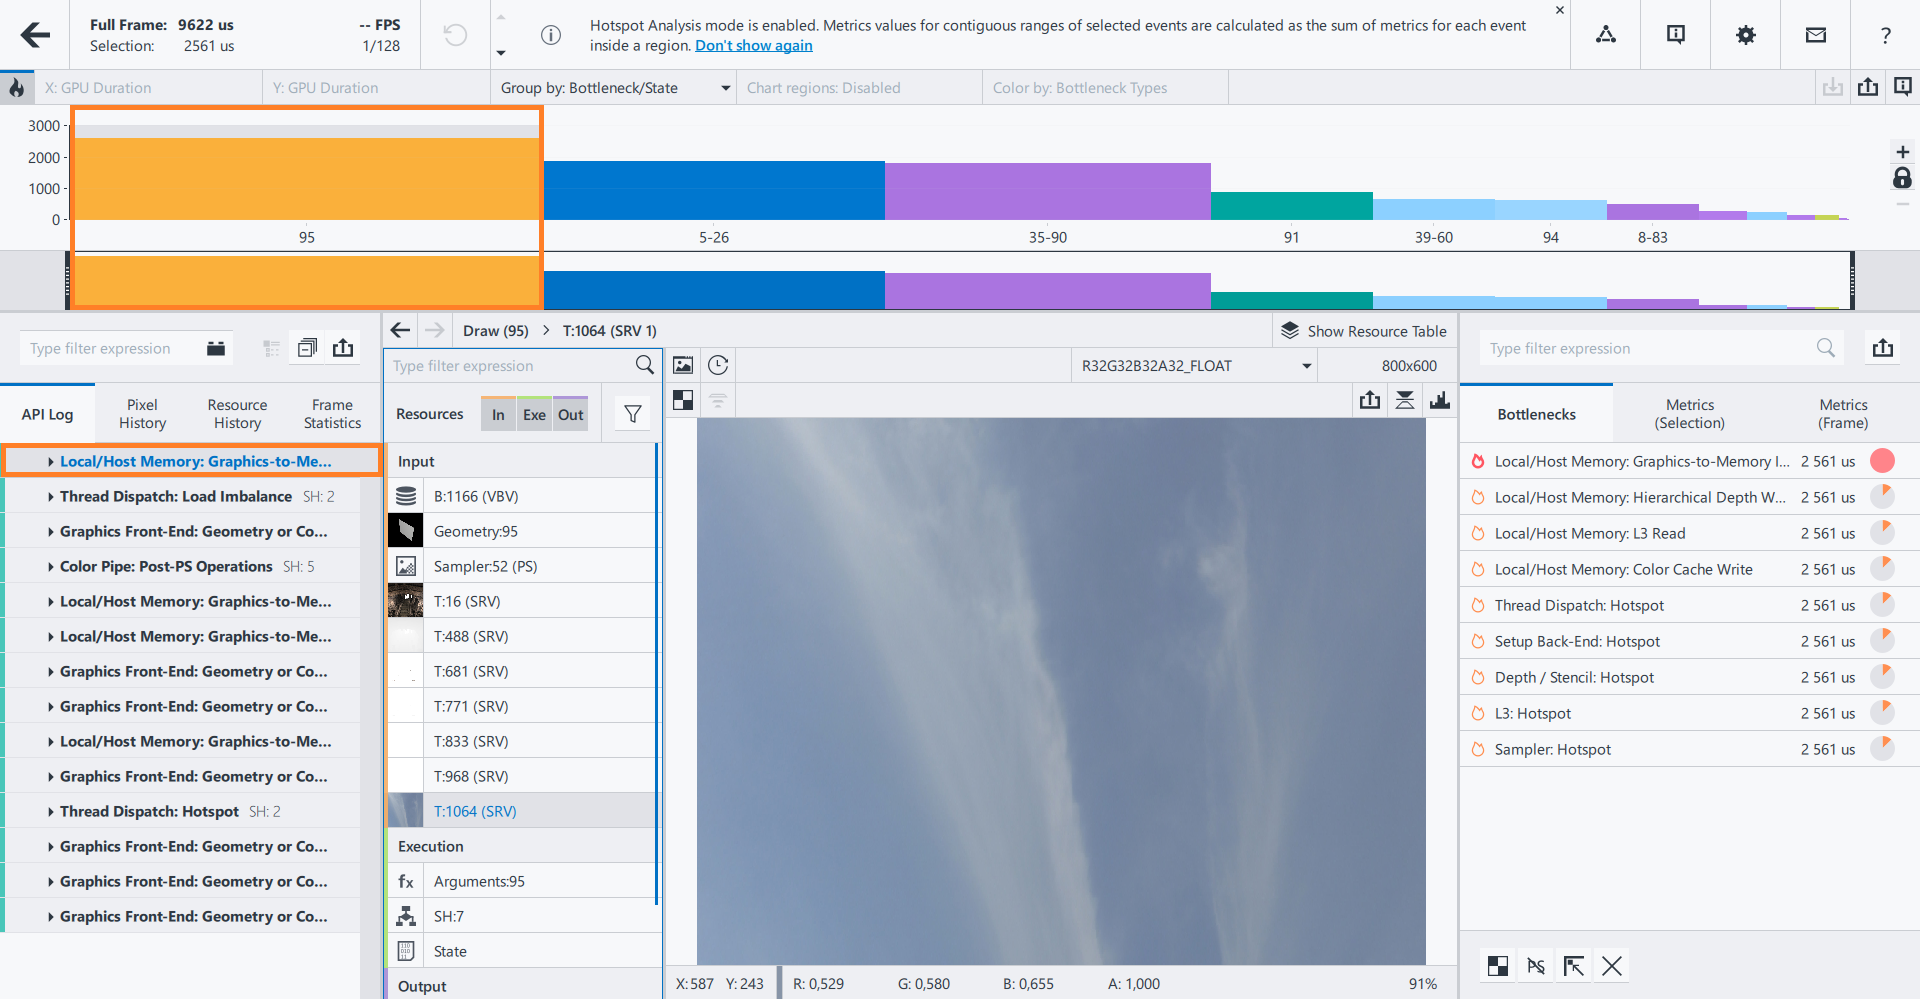
Start resolving issues with the most impactful bottleneck. Click the first group of draw calls either in the Visualization or API Log pane.

The resources associated with this group of calls appear in the Resources pane. The Bottlenecks tab of the Metrics pane presents color-coded bottlenecks for the selected group of calls.
In the Bottlenecks tab, click the red bottleneck, for example, Local/Host Memory: Graphics-to-Memory Interface.
The bottleneck cause, hints, and related metrics appear.
Work over the groups of draw calls and resolve the root causes of the bottlenecks. This may produce a large positive performance impact, since you can apply optimizations that commonly affect a large group of draw calls each time.
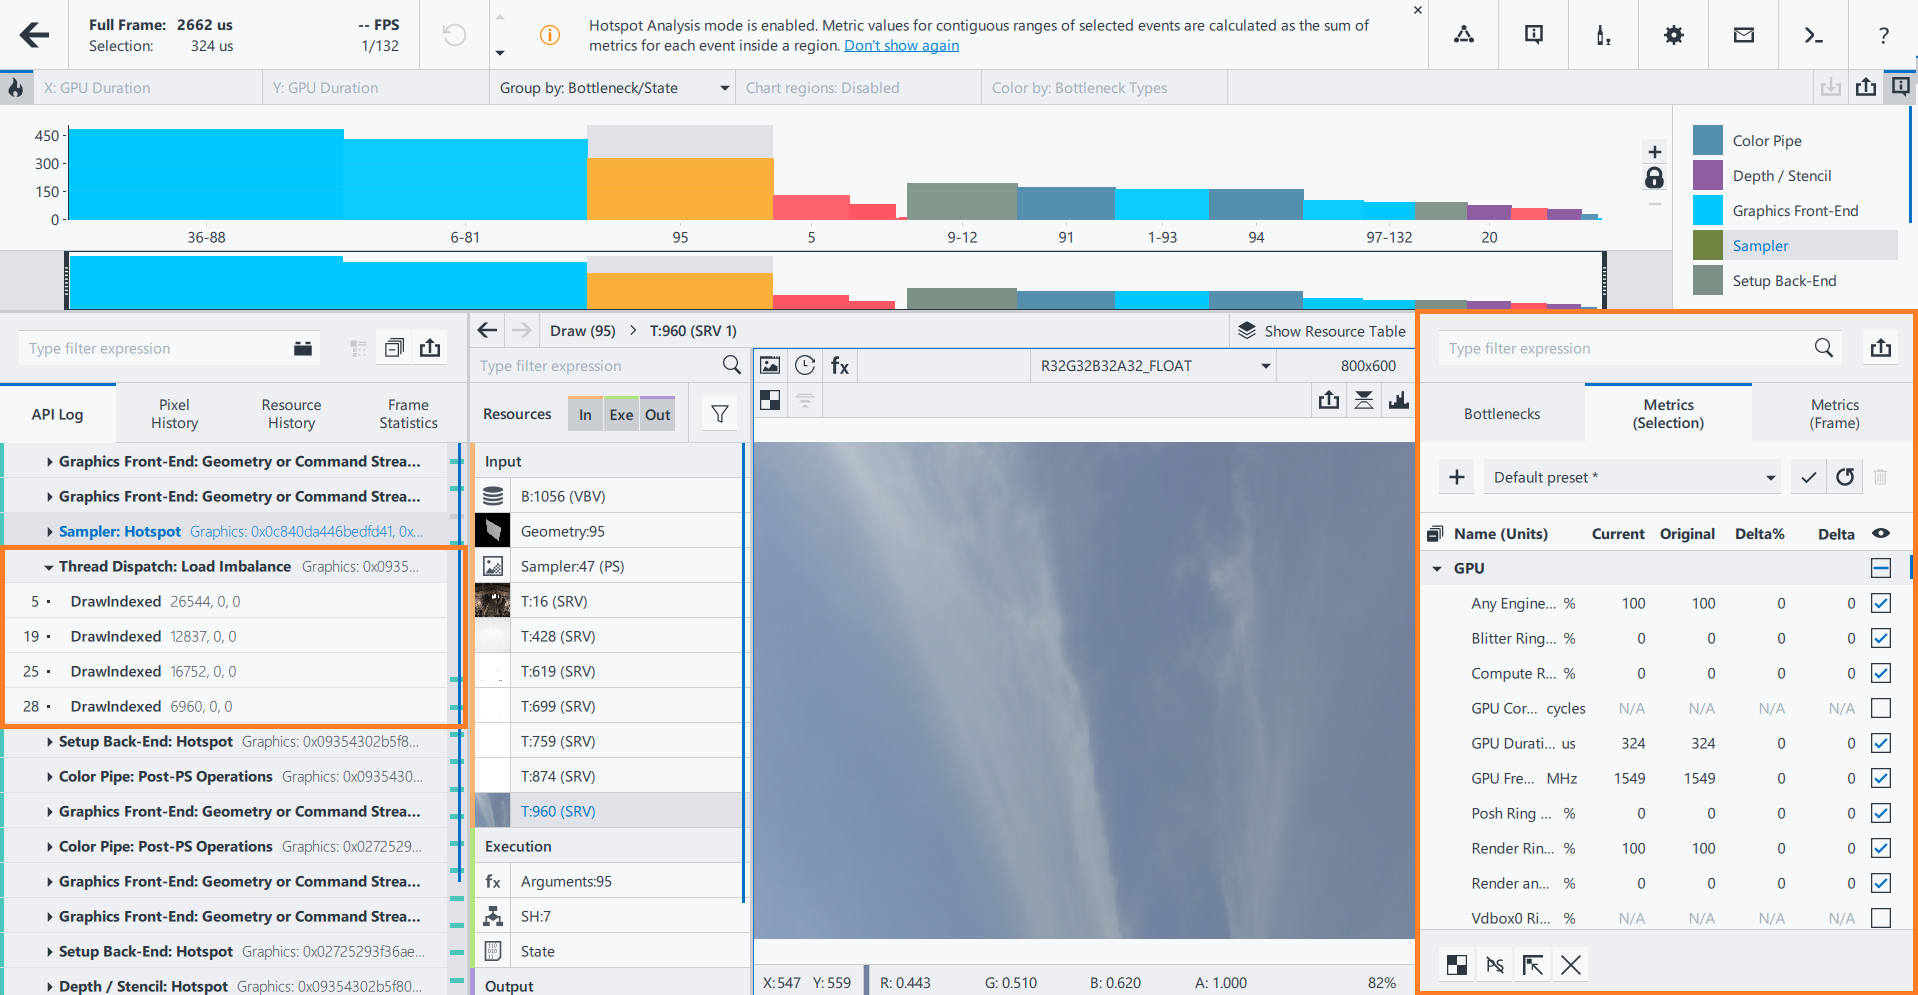
In the API Log, each grouping can be expanded to reveal all of the events contributing to the hot spot.
In the Metrics pane, you can explore metrics in detail. Metric values are an average/weighted value for the selected region.

For the Advanced Profiling mode back end flowchart and detailed bottleneck descriptions, see the Intel® Graphics Performance Analyzers Cookbook.