A newer version of this document is available. Customers should click here to go to the newest version.
Identify Issues in Graphics Application Execution with Trace Analyzer
Use Graphics Trace Analyzer to:
Identify problem areas in graphics application execution: analyze calls to graphics APIs such as Microsoft DirectX*, Vulkan* or OpenGL* , review user-defined debug markers, threads, queued GPU commands.
Perform a high-level analysis of synchronization and parallelism efficiency, relations between dependent threads and objects.
Evaluate workload performance across the CPU and GPU.
Graphics Trace Analyzer captures a trace, which is a record of activity on both the CPU and the GPU during application execution.
Capture and Open a Trace
Before the analysis, stop all irrelevant applications that utilize the GPU. You cannot identify performance issues accurately when several apps are competing for the GPU resource.
To capture trace data during the application run, do the following:
Configure Analysis Settings
Launch Graphics Monitor.
Click the Options button on the lower left of the Graphics Monitor configuration window.
In the Trace tab, configure tracing options as needed: set trace duration, choose data domains, enable data capturing on application startup.
Optionally, configure other analysis settings:
In the Metrics tab, select a set of default GPU/CPU metrics to monitor for your application
In the Triggers tab, you may specify a condition to start a trace capture automatically.
Exit the Options screen by clicking the
 Back button on the upper left of the screen.
Run Analysis
In the Graphics Monitor Launcher screen, specify an application for analysis.
Choose the Trace mode from the launch modes drop-down menu on the lower right.
Click the Run Application button to launch the application. A window with the game running opens.
Capture a Trace
Choose one of the following methods to capture the trace data to a file:
HUD (recommended)
In the window with the target application running, press Ctrl+Shift+T (default). When the capture is complete, a message is displayed just below the HUD with the filename or possible errors, if any.
NOTE:Hot keys may interfere with game keyboard usage. In this case, you can:Set up a trigger in Graphics Monitor to automatically create frame/trace capture files when certain conditions occur, for example, when FPS is 20.
Use
 Capture Trace button in System Analyzer.
System Analyzer
Return to the Graphics Monitor configuration window and click the
 Connect System Analyzer button next to your application. The button becomes available after you start the application.
Click the
 Capture Trace button to capture a trace. When the capture is complete, the System Analyzer displays a message with the filename or possible errors, if any.
System View Trace
Use System View capture from System Analyzer when:
The methods above do not work for you.
You want to see system data (like GPU utilization) and not execution data for the application (like API calls or debug regions).
Click the Optionsbutton in the Graphics Monitor.
In the Trace tab, set Trace System View in System Analyzer toggle to ON.
Open System Analyzer.
Start your application:
From Graphics Monitor, hover over the application and click the Run Application button.
Run the application from a file manager.
Return to the System Analyzer and click the
 Capture Trace button.
View Collected Data
To view the collected data:
Select the Traces tab in the Graphics Monitor. To open the trace, double click the thumbnail or click Open Trace.
From the Graphics Monitor context menu, launch Graphics Trace Analyzer.
In the Open Trace Capture window, select and open the captured trace file.
Trace Data
Trace represents data captured from graphics applications. During the rendering process, applications submit hundreds of graphics commands from different threads. The graphics driver interprets the commands for the GPU, puts them into command buffers, pushes the buffers into a CPU queue, and schedules the commands for execution on the GPU, forming a final frame on the screen.
GPU Activity Data
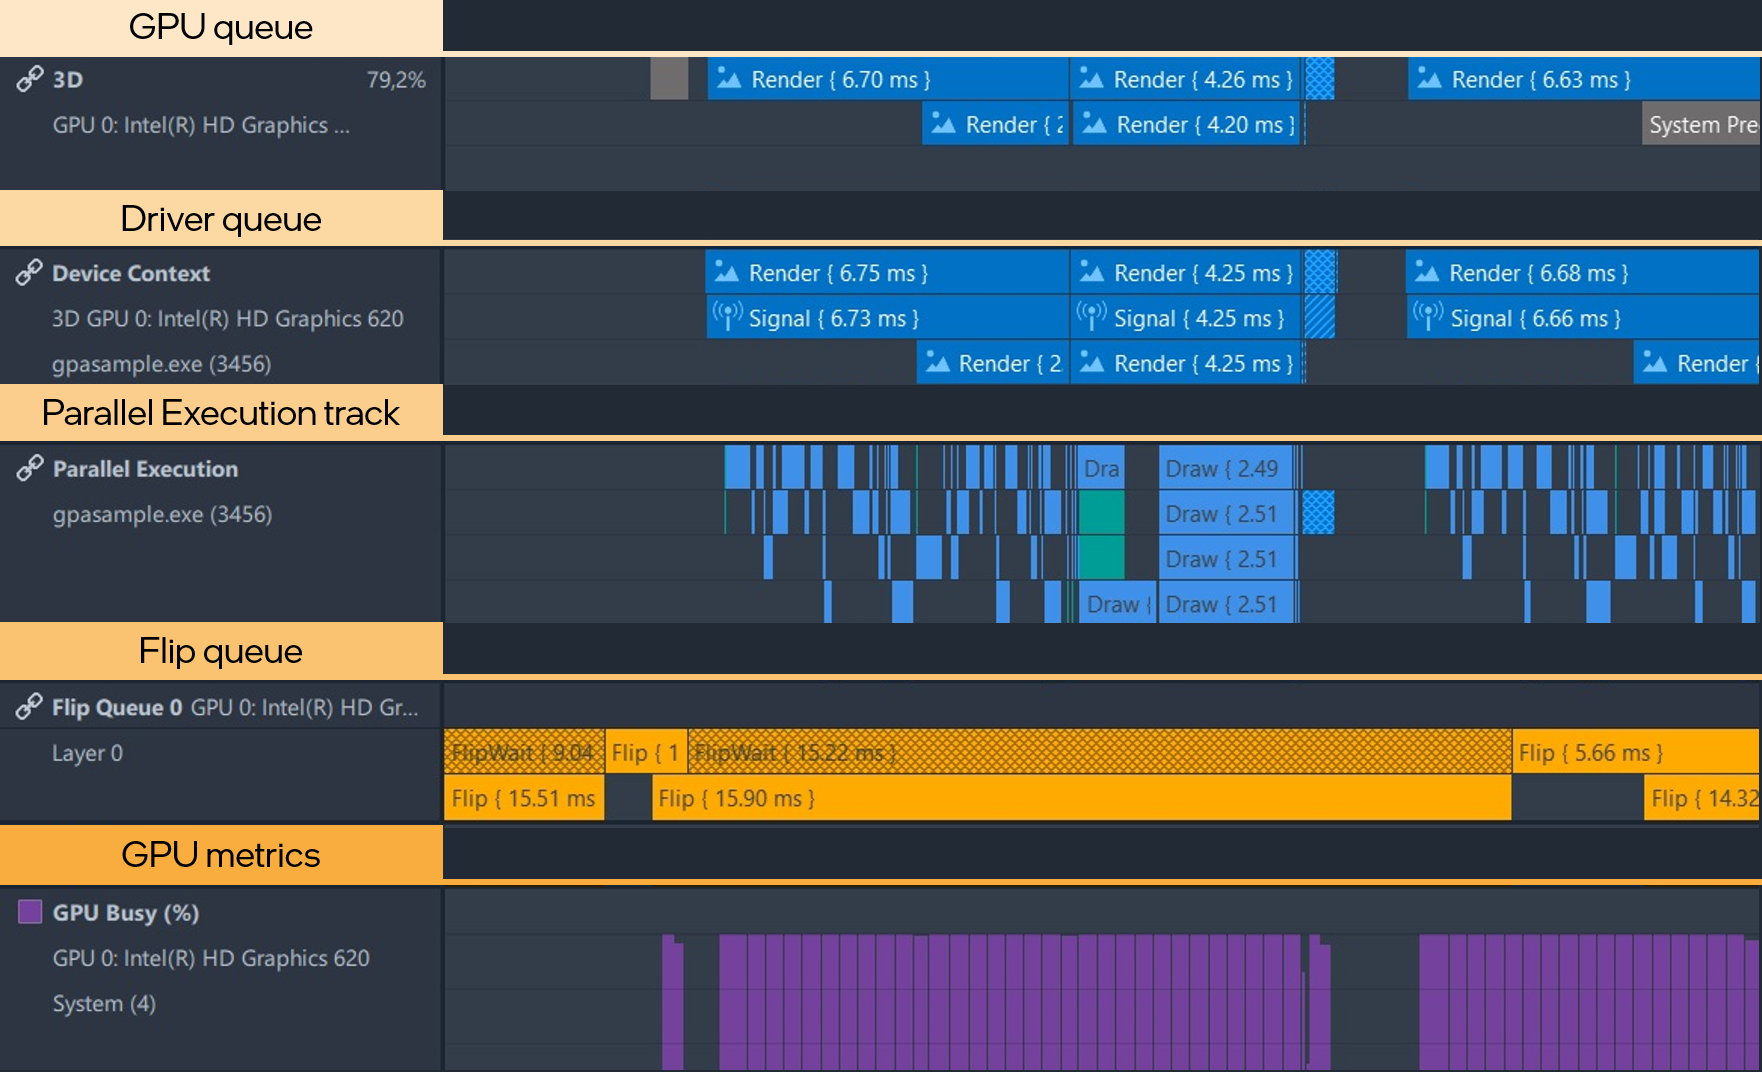
GPU queue shows how the GPU executes commands forming a final frame on the screen. The GPU queue indicates whether the GPU is busy or idle.
Driver queue shows how the graphics driver schedules graphics commands for execution on the GPU. The driver queue shows how many graphics commands are submitted, and how many of them are waiting for execution.
Parallel Execution track shows how the driver parallelizes execution of submitted render commands (draw, clear, dispatch, resource barriers). The track is available for DirectX apps.
OpenCL Execution track visualizes execution of OpenCL kernels on a GPU or a CPU.
Flip queue reflects the relationship between the application present calls, present packages of GPU/CPU queues, composition work performed by the Desktop Window Manager (DWM), and Vertical Synchronization (VSync) events. Flip queue data allow you to roughly estimate the frame rendering latency, which includes present, flip, and VSync events.
GPU metrics show GPU performance for the selected metrics set. Place the metrics track next to the GPU queue to see the correlation between application execution and GPU workload. For example, identify whether the GPU was busy during the processing of a certain package.
CPU Activity Data
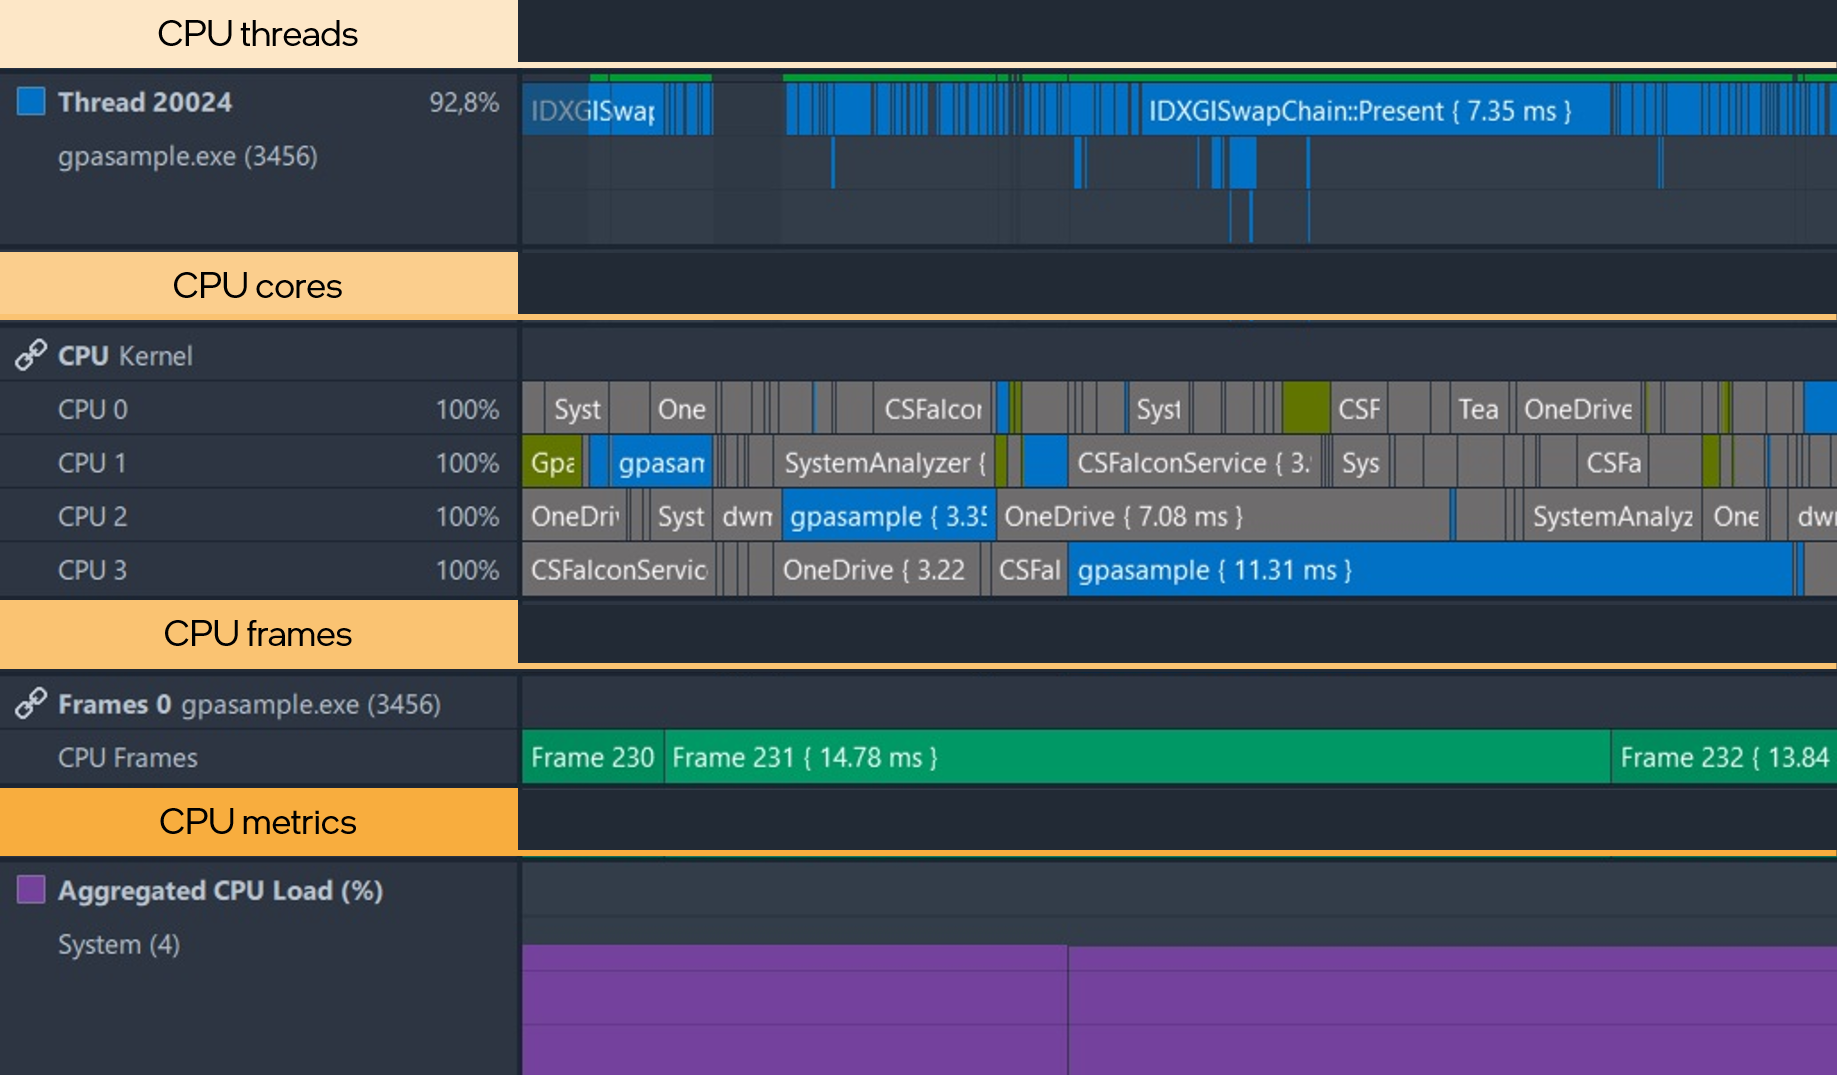
CPU threads track represents the activity of each thread: graphic API calls (draw calls, buffer locks, resource updates, presents), and user-defined debug annotation markers (Microsoft PIX, Instrumentation and Tracing Technology API (ITT API)).
CPU cores track shows how threads from different processes including your profiled application are executed.
CPU frames track shows the range containing graphics commands between two successive frames’ buffer swap calls.
CPU metrics show CPU performance for the selected metrics set. CPU and GPU metrics help you compare CPU and GPU utilization, and spot problematic areas.
Identify Performance Issues
Your workflow may look like this:
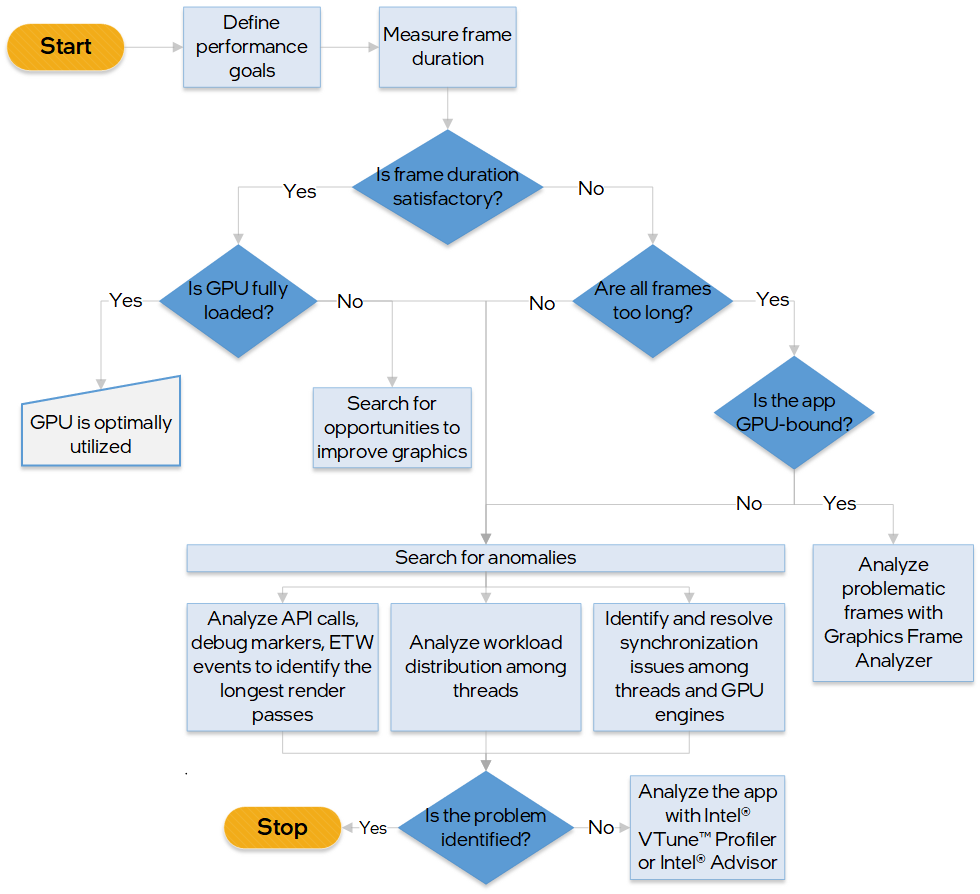
The proposed workflow focuses on game analysis. The steps may differ if you aim to optimize content creation applications.
Define Performance Goals
Set clear optimization goals based on the style, dynamics of the game, and the hardware your audience might use.
Different game types such as shooters or storytelling games imply different optimization goals, for example:
Increase frame rate. The more dynamic the game is, the shorter the frames should be. At the same time, if the frame rate of the game is too high, the user may not see some of the rendered frames.
Optimize visual content representation. Depending on the game type, you may be interested in identifying additional GPU resources for better detailing, for example, for elaborate landscapes or textures.
Reduce frame duration for cloud gaming. Applications developed for cloud gaming have a restricted budget for each frame. In this case, there is a complex process behind the frame rate: receiving the user input, sending it to the server, processing, frame rendering, compression, sending data over the network, decompression, and displaying the frame on the screen.
Measure Frame Duration
You can use either frame rate or duration as a metric for analysis. For more precise results, start performance profiling with frame duration. The frame duration is measured in milliseconds and shown in curly braces for each frame in the CPU Frames track.

If the CPU Frames track is not available for your application, estimate the frame duration using present tokens. On the Driver queue track, select a range from the right border of a present packet to the right border of the next one. You can see the frame duration on the timeline.

Make sure the frame duration is consistent and meets your performance goals. For example:
If frame duration is satisfactory, you can analyze whether the GPU is optimally utilized and inspect available GPU resources to incorporate more state-of-the-art graphics in the game.
If all frames take longer than expected, you can identify whether your application is GPU-bound and inspect issues with Graphics Frame Analyzer.
If frame duration varies greatly, you can spot anomalies with Graphics Trace Analyzer: analyze API calls, parallelization, synchronization, ETW events, and debug API markers in more detail.
Analyze a Game with Satisfactory Frame Duration
If the frame duration is satisfactory and the GPU is loaded with instructions all the time, your game probably utilizes the GPU optimally.
If the frame duration is satisfactory and the GPU is not loaded all the time, visible gaps in the GPU queue may indicate the following:
Underutilized GPU resources
Improper graphics workload balancing
Synchronization issues.
First, analyze how graphics workloads are distributed across CPU threads, and check GPU-CPU and GPU-GPU synchronization. For example, in the screenshot below, the gaps in the GPU and Driver queues indicate that the CPU is waiting for a signal from the GPU to resume processing and prepare the job for the GPU. In this application, the frames are rendered in triplets, and GPU-CPU synchronization increases the duration of the first frame in each triplet nearly fourfold. GPU-CPU synchronization is visualized with green arrows in Graphics Trace Analyzer:
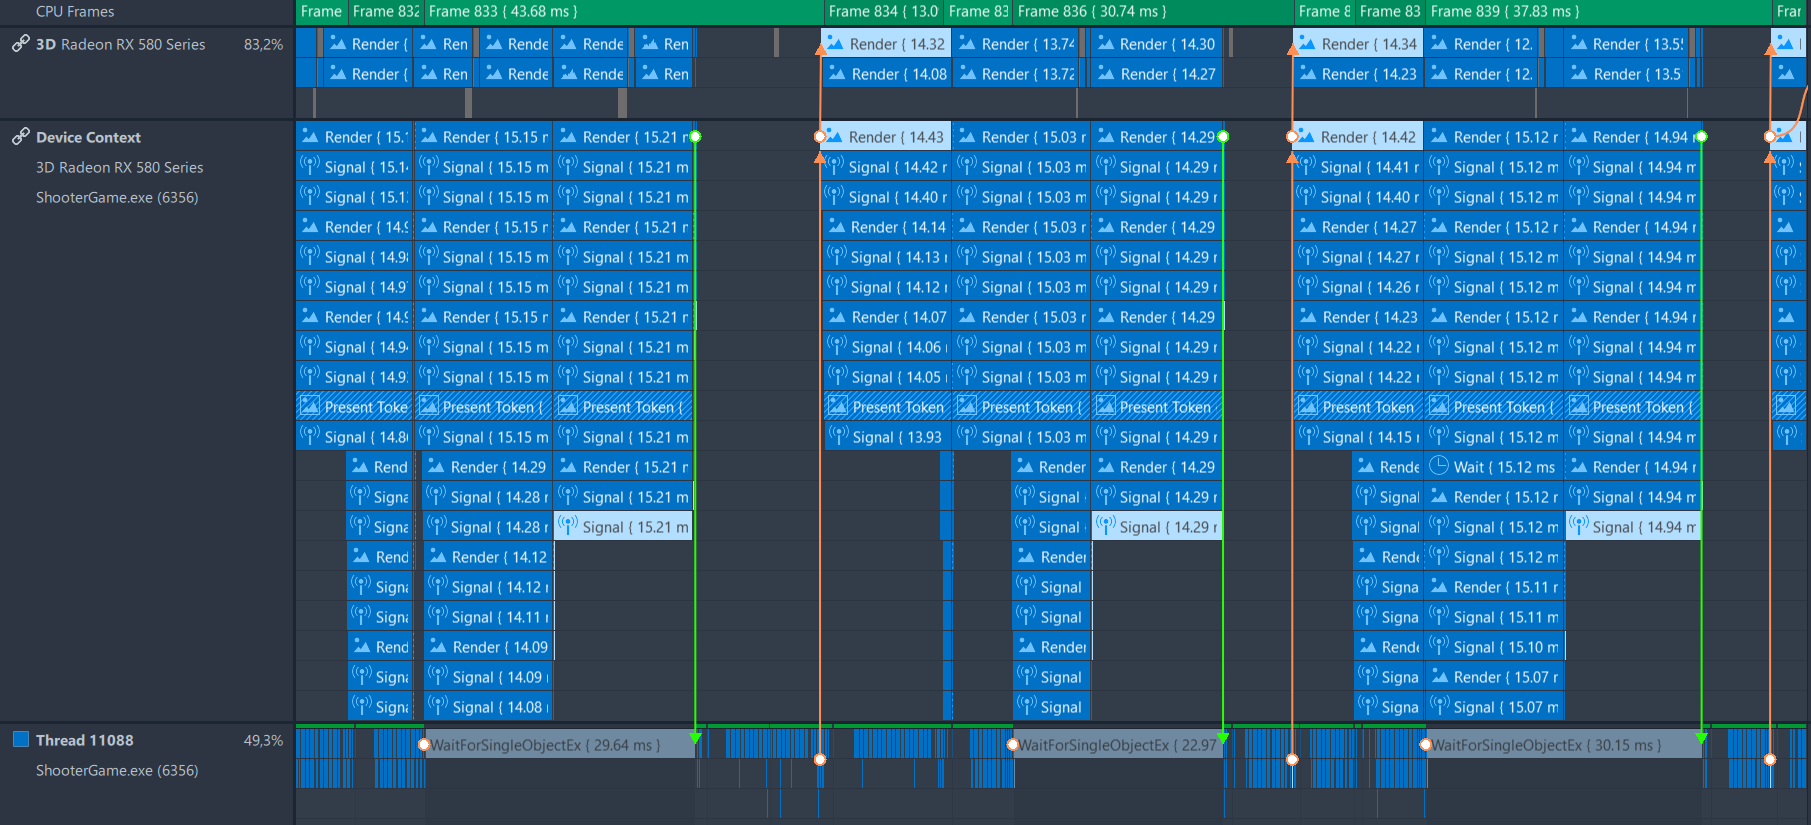
In such cases, check whether there is a good reason for synchronization, whether you can change this and how your improvements will affect the gameplay.
Tip: Refer to the video “What Do I Do If the GPU Shows Idle Time” to learn how to analyze a game where the GPU is underutilized.
If a GPU queue is not full and synchronization works properly, the GPU has resources that you can use to incorporate state-of-the-art graphics effects in a game without decreasing the frame rate. For example, you can add beautiful post-processing or textures.
Analyze a Game with Unsatisfactory Frame Duration
Consistently long frames may indicate that your game is GPU-bound. You can identify a GPU-bound game by the following criteria:
The GPU is busy the entire time and the GPU queue has no visible gaps.
The Driver queue continuously accumulates command buffers waiting for execution on the GPU. In this case, the Driver queue size is long.
Average DMA buffer execution time exceeds the desired limit based on the expected frame duration.
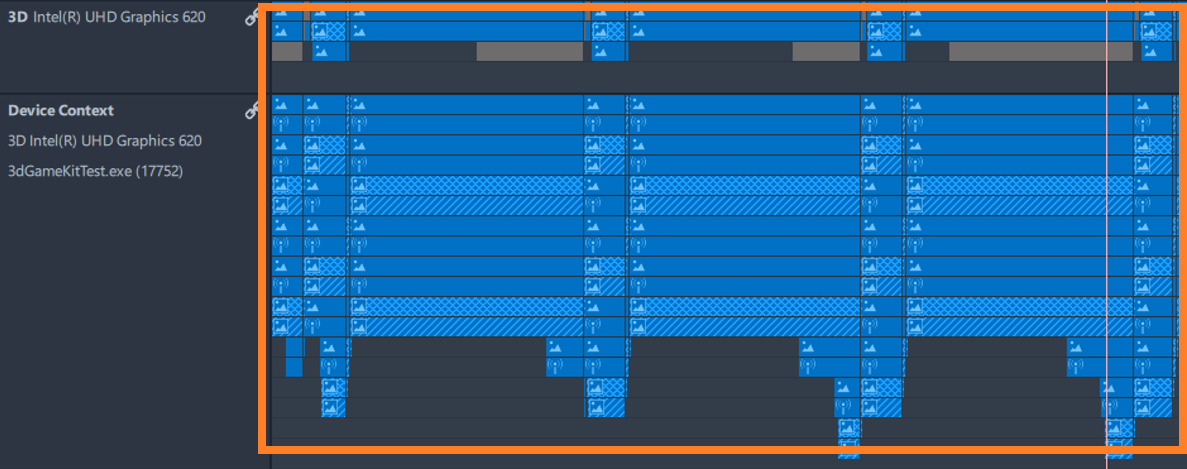
CPU threads are inactive most of the time. The thread activity zone above the CPU thread track contains green or grey intervals indicating whether the thread was active or inactive during a particular period.

If your application is GPU-bound, capture a stream or a frame of a problematic area and analyze rendering performance in-depth using Graphics Frame Analyzer.
In other cases, when frame duration varies, search for anomalies with Graphics Trace Analyzer:
Analyze API calls, debug markers and Event Tracing for Windows* (ETW) events to identify the longest render passes
Analyze workload distribution and synchronization among threads.
If your case needs more in-depth analysis, use other CPU-side performance analysis tools offered by Intel:
Use Intel® VTune™ Profiler to find your hotspots and identify issues related to CPU utilization
Use Intel® Advisor for a deep focus on threading and vectorization.