A newer version of this document is available. Customers should click here to go to the newest version.
API Log

The API Log consists of the following elements:
API Log toolbar
API Log tab
Pixel History tab
Resource History tab
Frame Statistics tab
Tabs in API Log use a shared set of controls for all item types.
Action |
Hotkey or Shortcut |
|---|---|
Select Item |
Click |
Toggle Item Selection |
Ctrl + Click |
Navigate Through Items |
Arrow Keys, Page Up/Down |
Select First/Last Item |
Home/End |
Extend Selection |
Shift + Arrow Keys, Shift + Page Up/Down |
Extend Selection to First/Last Item |
Shift + Home/End |
Select All |
Ctrl + A |
When you select an item in the Bar Chart View, Graphics Frame Analyzer highlights the corresponding items in the API Log tabs.

API Log Toolbar

Use the API Log toolbar to manage the API Log:
Use Type Filter Expression to:
Filter API Log items by name or description.

Filter calls by number, use the # symbol followed by the starting digits. To select a specific call number, add a space at the end.
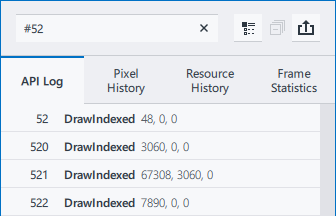
Filter the history.
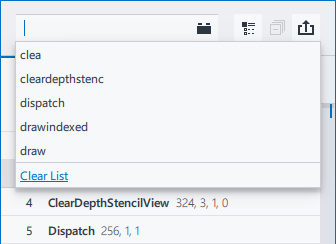
Find specific events. Run
 Graphics Frame Analyzer Plugins for this purpose.
Display all the functions used in the frame in the API Log, in the call order.
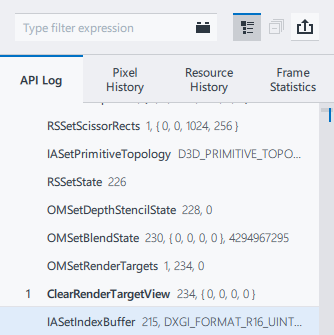
By default, the API Log tab shows only graphics API functions that produce any GPU activity, such as draw calls or clear calls. These graphics API functions are also called “events”.
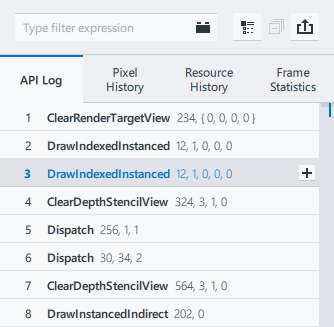
Where available, collapse all groups in the API Log tab.
Export the API Log in CSV format. You can also export the API Log by pressing Ctrl+S.

API Log Tab
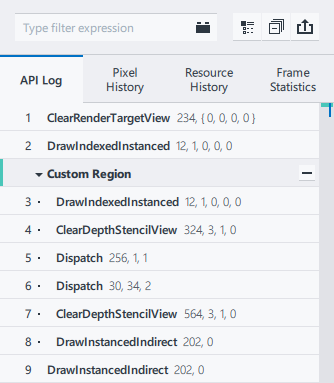
Review the list of all functions in the GPU execution order, along with the parameters passed to each of them.
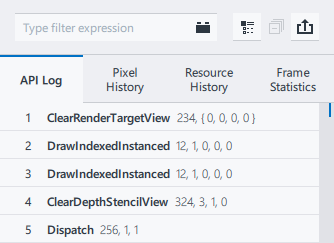
To group events, use the Group By drop-down button on the Bar Chart Toolbar.

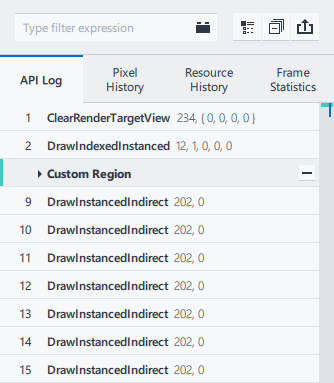
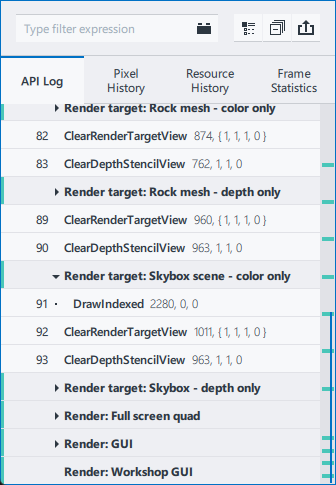
You can expand or collapse a region by clicking the triangle to the left of the region name or use Right/Left arrow keys when the region is selected.
To display user-defined instrumentation (Microsoft PIX) markers and regions, select Debug Regions from the Group By drop-down.
To create a custom region, do the following:
In the Bar Chart Toolbar, select Custom Regions in the Group By drop-down list.
In the API Log tab, select an event or a group of sequential events, and click
 .
.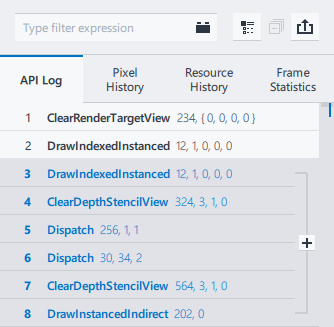
Enter a name for the custom region. To delete the created custom region, click
 .
.
To add a nested region inside a created custom region, click
 . The depth level is indicated by the number of dots preceding the event name.
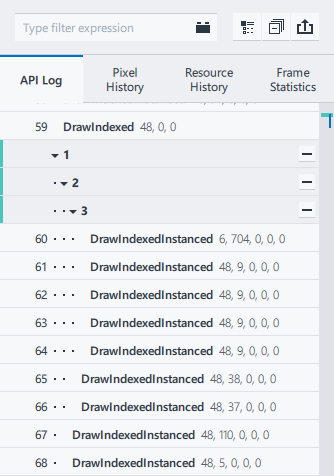
Created custom regions are saved between frame opens. Custom regions are not available in Advanced Profiling Mode.
Pixel History Tab
The Pixel History tab shows only the events that contribute to the pixel specified in the Resources tab. Pixel History analysis is supported for DX11 Frame/Stream on Windows, DX12 Frame (Legacy) on Windows.
To analyze Pixel History, click on the render target pixel you want to analyze in the Resource Viewer. To use precise coordinates, modify the coordinate fields in the Pixel History tab. Then click Go. Graphics Frame Analyzer marks the selected pixel with a crosshair and filters the API calls to display only those events that affected this pixel. The colored boxes next to each call show the color written into the frame buffer after the API call execution. Also, under each draw call, there is information about how many times the pixel was touched by this particular call. If the call was rejected at a stage in the pipeline, the ![]() box appears next to the call. The reason for rejection displays below.
box appears next to the call. The reason for rejection displays below.
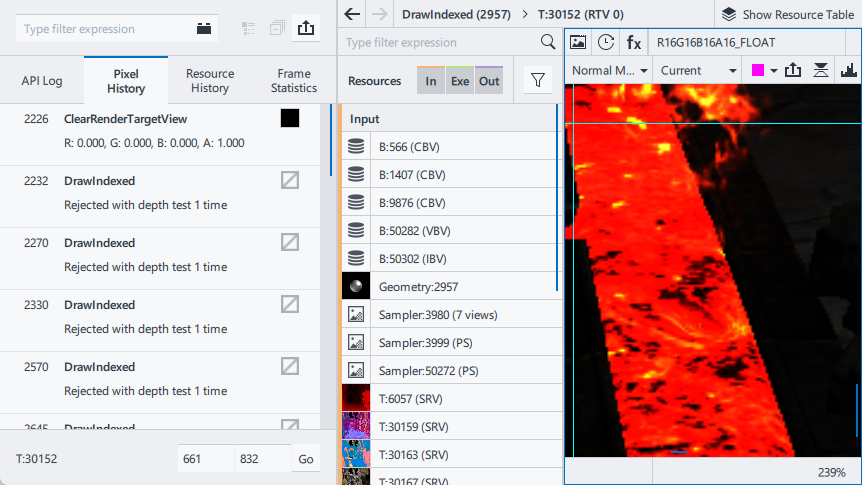
Resource History Tab
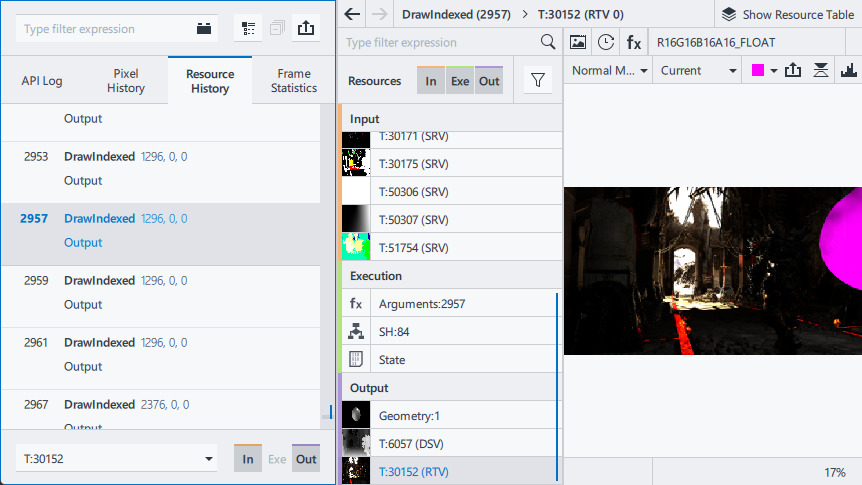
The Resource History tab shows only the events that use the resource selected from the Resource List.
- To see the history of a resource either:
-
Double-click on the resource in the Resource List
Select the resource and click the
 button.
Choose the resource from the Select Resource drop-down list in the Resource History tab.
Frame Statistics Tab
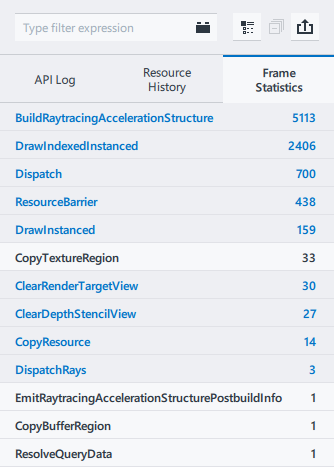
The Frame Statistics tab shows the count of each event type within the frame. Event types that correspond to the current selection are highlighted. To select all events of a specific type, click on the event type.