A newer version of this document is available. Customers should click here to go to the newest version.
Graphics Frame Analyzer Window: Dependency Viewer
Dependency Viewer is a tool for exploring the dependencies in frames captured with Graphics Frame Analyzer. The tool is available for DirectX* 11 and DirectX* 12.
To open the Dependency Viewer, do the following:
Open a frame in the Profiling View window of the Graphics Frame Analyzer.
Click the
 Dependency Viewer icon on the main toolbar at the top of the page.
The Dependency Viewer opens in a browser window.
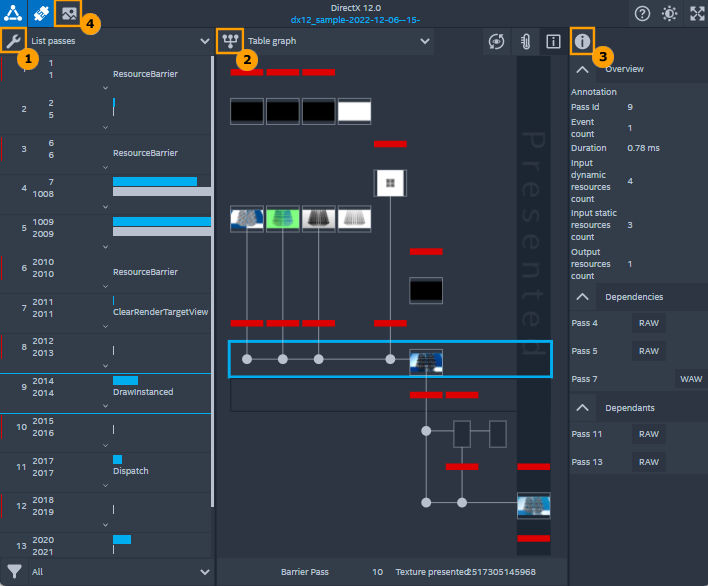
The Dependency Viewer window consists of resizable panels, each of which could be configured to display one of the following views:
|
|
|
|
|
|
|
|
You can switch the desired view for each panel by clicking on the view icon (![]() ) in the top left corner of each panel.
) in the top left corner of each panel.
Additionally, you can enable resource content previews by clicking the Preview Thumbnails button (![]() ). However, keep in mind that for large frames extraction of all render targets may take a considerable amount of time.
). However, keep in mind that for large frames extraction of all render targets may take a considerable amount of time.
Tools View
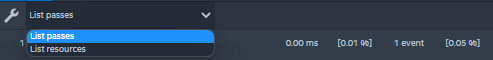
The  Tools view shows the structure of a frame in a table format. You can choose between the List passes or List resources mode via the drop-down menu:
The passes list shows the sequence of render passes in the order they are executed in the frame. A render pass is a sequential list of graphic events writing to the same set of resources. A graphic event is an API call that generates a GPU command such as Draw, Dispatch, Copy, and so on.
Each entry on the passes list consists of the following:
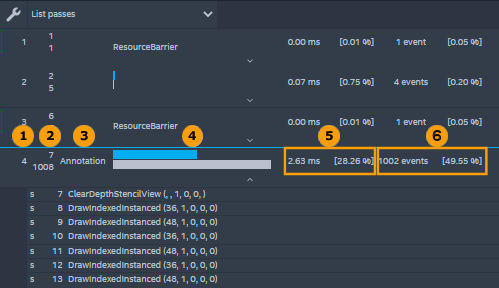
 Pass ID that matches the Graphics Frame Analyzer IDs.
  The two IDs of the first and last graphics events in the render pass that match the IDs in Graphics Frame Analyzer.
  User-defined annotation that can be specified in the Inspector view.
  Blue and gray horizontal bars illustrate the duration of the render passes and graphic event count, respectively. Bars are normalized relative to the longest render pass in the frame. In case of single-operation passes, the operation pass name is shown instead of a gray bar.
  Duration of the render pass in milliseconds and percentage of the frame duration.
  Count of graphic events in the render pass as well as the percentage of total events in the frame.
Use the Expand button to see the list of graphic events in the render pass. All events that perform reads from CPU-produced resources are marked with s on the left. Additionally, Resource Barriers are marked with a red bar on the left.
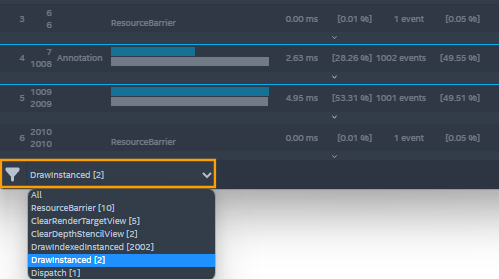
Use the filter field at the bottom of this view to highlight passes containing operations of a given type:
This tool shows basic information about each resource generated in the frame. There are two separate lists of textures and buffers.
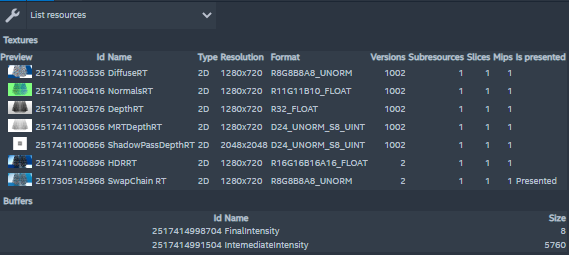
The tool represents each texture by a row containing the following information:
- Thumbnail of the resource on the last graphics event that modifies it. Thumbnails are not collected by default and must be enabled via the
 Preview Thumbnails button at the top of the Dependency Viewer.
 - ID that matches the Graphics Frame Analyzer resource IDs.
- Debug name, if available in the captured frame. This value can be manually specified or overridden in the
 Inspector view.
 - Texture type
- Resolution
- Format
- Number of sub-resources, slices, and mips
- Flag for resources presented on the screen
Each buffer row contains an ID, a name, and a size in bytes.
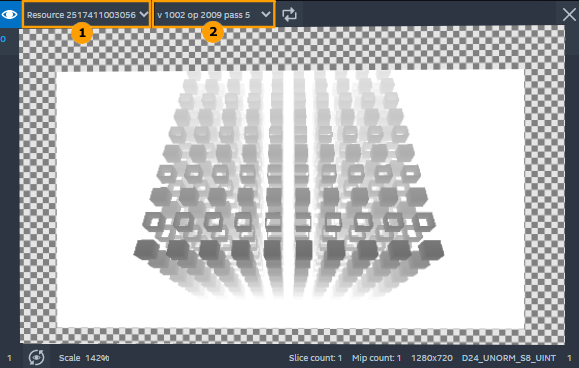
Double-click a texture row to open the Resource Preview that enables you to switch between textures and their versions or compare two versions of the same resource:
Graphs View
The  Graphs view shows render pass dependencies: pass reads from the resources produced by other passes. This view could operate in either a Table graph or a Focused graph mode.
Table Graph
The Table graph helps you visually analyze the frame structure:
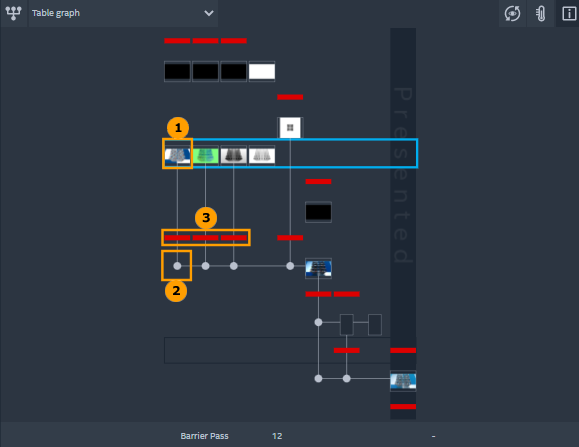
- Rows represent rendering passes; columns represent resources. If a pass N writes to resource M, a graph node representing the state of the resource at the end of the render pass is placed in row N, column M.
- Each node shows a brief resource description:
- View type: Render Target (RT), Unordered Access (UA), Depth Stencil (DS).
- For textures (can be toggled on or off via the Texture Information button): Format, Dimension, Number of slices, Number of mips, and Preview (if enabled via the Preview Thumbnails button at the top of the Dependency Viewer).
- If a pass reads from a resource, a dot is placed underneath it in the same column with the input view type: Shader Resource (SR), Constant Buffer (CB)
- Barriers are represented with a red bar and a letter representing its type, for example, T represents a transition. Ideally for optimal performance, a barrier should be right before the resource usage.
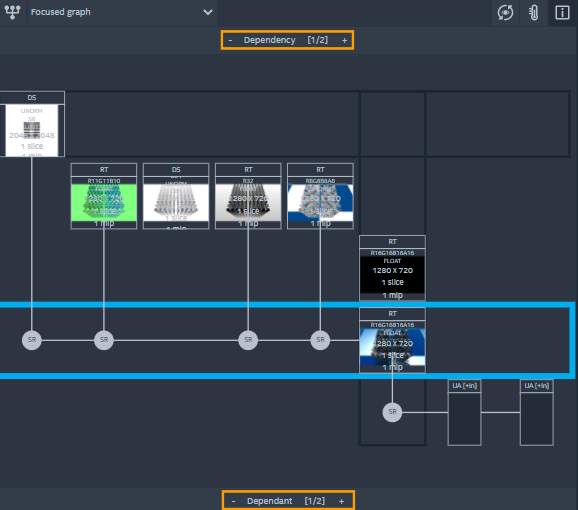
Focused Graph
Because graphs for the entire frame may be very complex, the Focused graph shows data similar to the Table graph but limits the depth of dependencies before and after the selected render pass. You can alter the dependency depth using the controls at the top and at the bottom:
Inspector View
The Inspector view displays additional information for the selected render pass, resource, or the buffer.
If you select a render pass in the Tools view, the following information is available:

Overview:
Annotation: An annotation for the selected render pass that will be displayed in Tools view. Click and type a required annotation here.
Pass Id: Render pass ID as it is listed in Tools view.
Event count: Number of graphic events in the selected render pass.
Duration: Duration of the render pass in milliseconds.
Input dynamic resources: Number of input resources with the content produced by another render pass.
Input static resources: Number of input resources with the static content.
Output resources count: Number of output resources for the selected render pass.
Dependencies: Number of preceding render passes with IDs from which the selected render pass uses dynamic resources. For each render pass, the list specifies the dependency type: read-after-write (RAW), write-after-read (WAR), or write-after-write (WAW).
- Dependents: Number of render passes with IDs which depend on the selected render pass. For each render pass, the list specifies the dependency type: read-after-write (RAW), write-after-read (WAR), or write-after-write (WAW).
Resource Inspection
If you select a texture is selected in the Tools view, the following information is available:
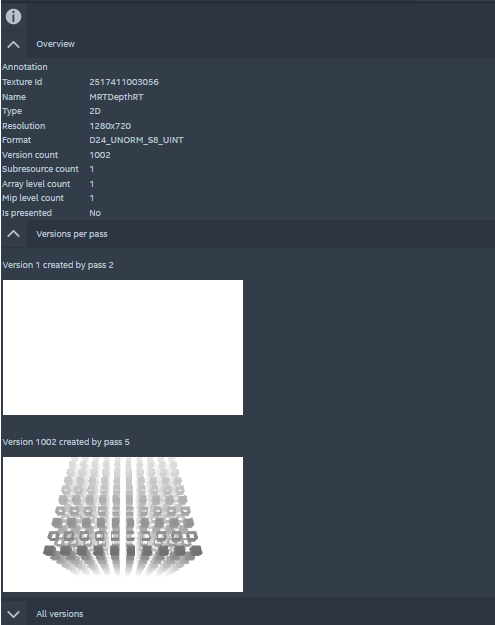
Overview:
Annotation: An annotation for the selected texture that will be displayed in Tools view. Click and type a required annotation here.
Texture Id: Texture ID as it is listed in the Tools view.
- Type, Resolution, Format, Subresource count, Array level count, Mip level count: Texture creation parameters.
Name: Texture name from the original application.
- Version count: Number of modifications of the texture in the frame.
Is presented: True if this texture was presented on the screen.
- Versions per pass: First and last versions of the texture in the frame. You can double-click a version to inspect it further in the Texture Preview view.
- All versions: All versions of the texture in the frame. You can double-click a version to inspect it further in Texture Preview view.
Buffer Inspection
If you select the buffer in the Tools view, then its overview is displayed:
Annotation: An annotation for the selected buffer that will be displayed in Tools view. Click and type a required annotation here.
Buffer Id: Buffer ID as it is listed in Tools view.
Name: Buffer name from the original application.
Size: Buffer size in bytes.
Walkers View
The  Walkers view automatically identifies and displays potential performance issues caused by redundant work, redundant allocated resources, and barriers that have been placed too early.
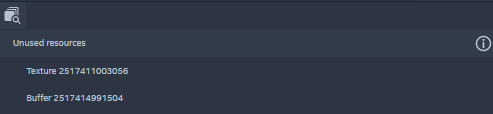
The Walkers view may produce false positives for the following reasons:
- Dependency Viewer takes only a single frame into account; cross-frame dependencies are not discovered. Multi-frame support is planned for a later release.
- Some depth buffers might be marked as unused because they are not read in subsequent passes but still do their job.