A newer version of this document is available. Customers should click here to go to the newest version.
Graphics Frame Analyzer Window: Profiling View
Use Profiling View to identify performance opportunities in the analyzed frame.
You can access the Profiling View window in several ways:
- Select the frame for analysis in the Open Frame Capture window and click Open
- Select a frame in the Open Frame Capture window and double-click on the frame preview
- Select a frame or a frame sequence in Multiframe View and click Open
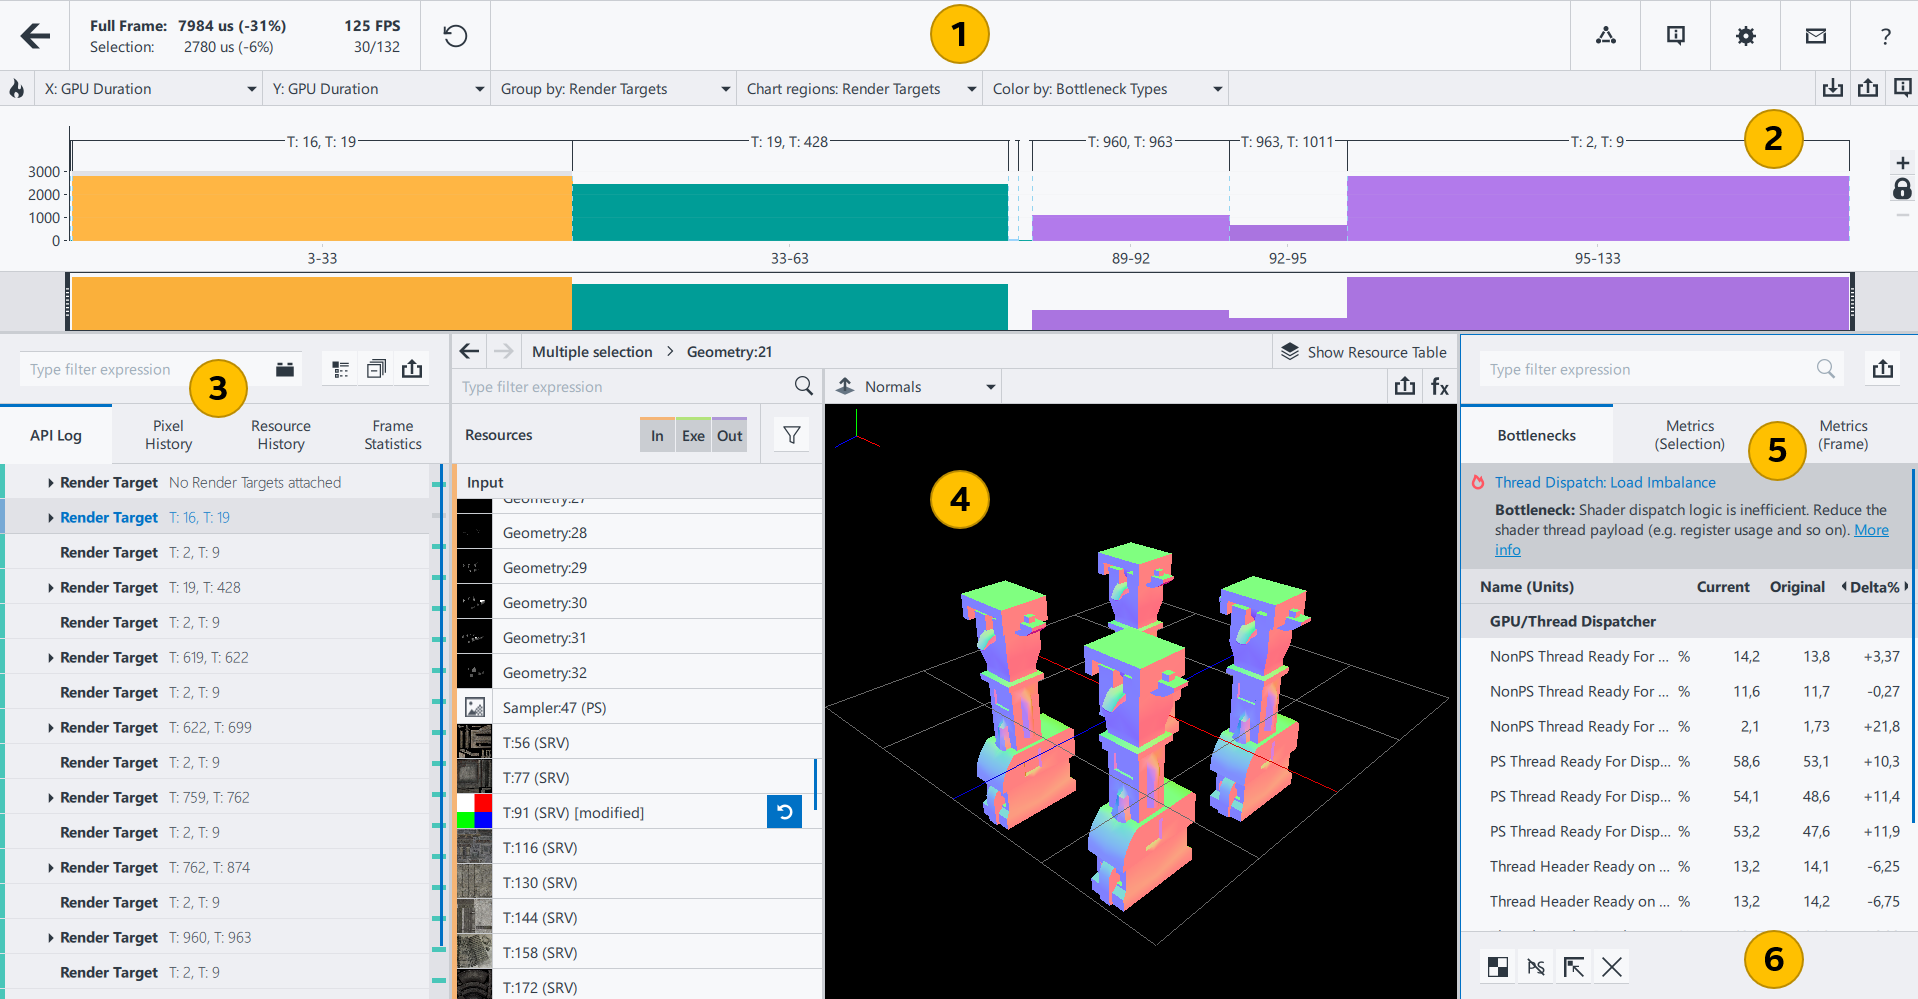
| Main Toolbar Displays the opened frame data, notifications, opens the Intel® GPA Online Help, restores the default view, and changes the Intel® GPA color scheme. |
|
| Visualization pane Displays the sequence of captured events in a graphical format based on GPU metrics. |
|
| API Log pane Displays the list of all graphics API functions used in the frame in the GPU execution order and parameters of each function. |
|
| Resources pane Displays all resources used by the selected graphics API functions. |
|
| Metrics pane Displays metrics information for the selected graphics API functions. |
|
| Experiments pane Discovers potential performance bottlenecks in your application by modifying render states of the graphics API. |