<strong>boolean: true</strong>
This recipe focuses on a step-by-step approach to vectorize a real-time 3D cardiac electrophysiology simulation application on an Intel® Xeon® platform using Intel® Advisor.
- Prerequisites.
- Establish a baseline.
- Use a higher instruction set architecture available.
- Vectorize outer loop.
- Use SIMD function.
- Optimize SIMD usage.
- Disable unroll.
- Performance summary.
- Next steps.
Scenario
This recipe describes how to use the Intel Advisor to analyze the application performance for vectorization. Use Intel Advisor recommendations to make changes to the source code iteratively and improve the application performance by 2.6x compared to the baseline result. The sections below describe in details all the optimization steps used.
Ingredients
This section lists the hardware and software used to produce the specific result shown in this recipe:
Performance analysis tools: Intel® Advisor
Available for download at https://www.intel.com/content/www/us/en/developer/articles/tool/oneapi-standalone-components.html#advisor.
Application: Cardiac_demo sample application
Available for download from GitHub* at https://github.com/CardiacDemo/Cardiac_demo.
Workload:
- Small mesh (17937 elements, 4618 nodes)
- Medium mesh (112790 elements, 28187 nodes)
Compiler: Intel® C++ Compiler Classic
Available for download as a standalone and as part of Intel® oneAPI HPC Toolkit.
Other tools: Intel® MPI Library
Available for download at https://www.intel.com/content/www/us/en/developer/tools/oneapi/mpi-library.html.
Operating system: Linux* OS (Red Hat* 4.8.5-39)
CPU: Intel® Xeon® processor (formerly code-named Cascade Lake) with the following configuration:
=====  Processor composition  =====
Processor name    : Intel(R) Xeon(R) Platinum 8260L
Packages(sockets) : 2
Cores             : 48
Processors(CPUs)  : 96
Cores per package : 24
Threads per core  : 2
To view your processor configuration, source the mpivars.sh script of the Intel MPI Library and run the cpuinfo -g command.
Prerequisites
Set Up Environment
Set environment variables for Intel C++ Compiler, Intel MPI Library, and Intel Advisor:
source <oneapi-install-dir>/setvars.shTIP:The default value for <oneapi-install-dir> is opt/intel/oneapi for root users and $HOME/intel/oneapi for non-root users.Verify that you set up the tools correctly:
mpiicc -v
mpiexec -V
advisor –version
If all is set up correctly, you should see a version of each tool.
Build Application
Clone the application GitHub repository to your local system:
git clone https://github.com/CardiacDemo/Cardiac_demo.gitUntar the file (*.tar.gz).
In the root level of the sample package, create a build directory, and change to that directory:
mkdir build
cd build
Build the application:
mpiicpc ../heart_demo.cpp ../luo_rudy_1991.cpp ../rcm.cpp ../mesh.cpp -g -o heart_demo -O3 -xCORE-AVX2 -std=c++11 -qopenmp -parallel-source-info=2You should see the heart_demo executable in the current directory.
If you want to run the demo:
export OMP_NUM_THREADS=1
mpirun -n 48  ./heart_demo -m ../mesh_mid -s ../setup_mid.txt -t 100 -i
Establish a Baseline
Run the Vectorization and Code Insights perspective on the built heart_demo application using the following commands:
mpirun -genvall -n 48 -gtool "advisor --collect=survey –-project-dir=<project_dir>/project1:0" ./heart_demo -m ../mesh_mid -s ../setup_mid.txt -t 100 -i
mpirun -genvall -n 48 -gtool "advisor --collect=tripcounts –-flop –-project-dir=<project_dir>/project1:0" ./heart_demo -m ../mesh_mid -s ../setup_mid.txt -t 100 -i
- Open the results in the Intel Advisor GUI.
Go the Summary report and review the metrics:
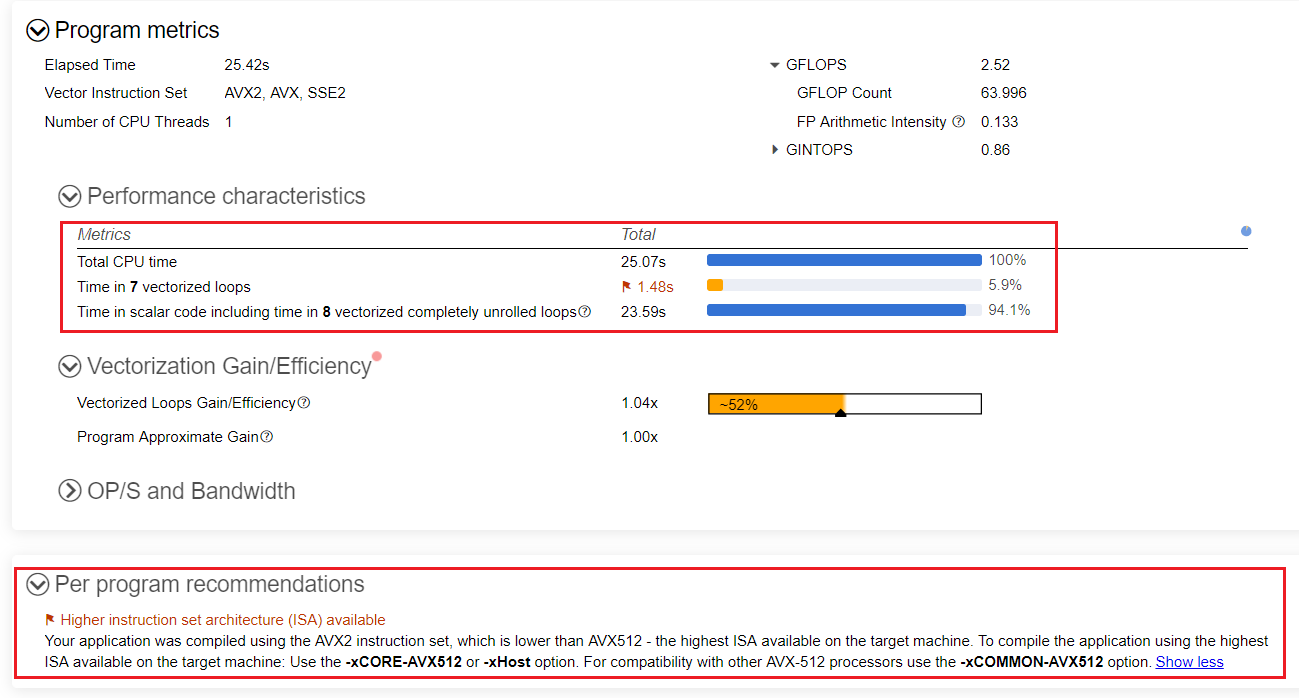
Only 6% of the total time is spent in vectorized loops, and the remaining 94% of total time is spent in scalar code.
The Per Program Recommendation suggests using Intel® Advanced Vector Extensions 512 (Intel® AVX-512) instruction set architecture (ISA), which is the highest ISA available on the target machine.
The heart_demo application runs and completes in 22.7 seconds.
NOTE:Time reported in the Summary may include the overhead added by Intel Advisor analyses.
Use the Highest Instruction Set Architecture Available
As the Intel Advisor recommends, use a higher ISA available of the machine to improve the overall application performance.
Add the -xCORE-AVX512 -qopt-zmm-usage=high option to the build command to use Intel AVX-512 and rebuild the heart_demo:
mpiicpc ../heart_demo.cpp ../luo_rudy_1991.cpp ../rcm.cpp ../mesh.cpp -g -o heart_demo -O3 -xCORE-AVX512 -qopt-zmm-usage=high -std=c++11 -qopenmp -parallel-source-info=2For more information about this option, see qopt-zmm-usage, Qopt-zmm-usage in the Intel® C++ Compiler Developer Guide and Reference.
Re-run the Vectorization and Code Insights perspective and go to Summary to view the result.
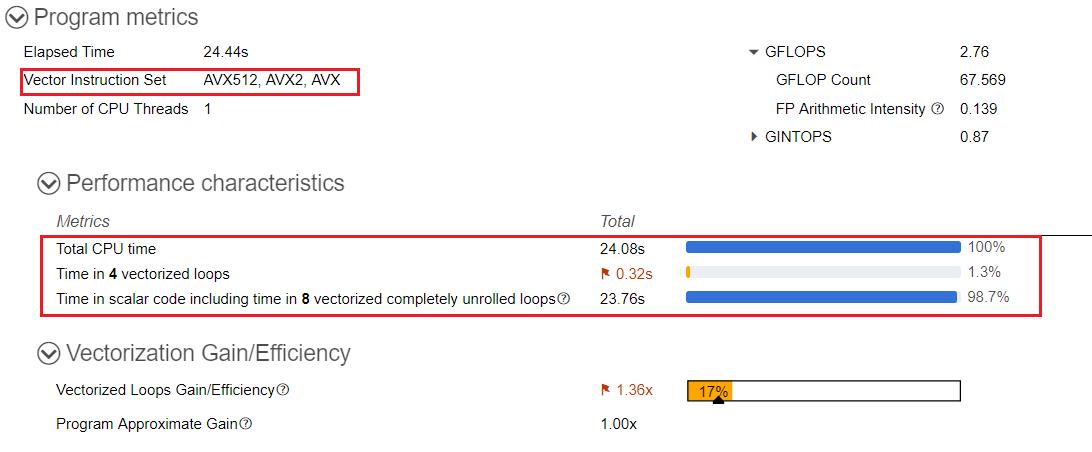
After optimization, the heart_demo application runs and completes in 21.2 seconds.
With the Intel AVX-512 instructions, the elapsed time for the auto-vectorized loops is reduced compared to the baseline. For instance, in the Survey & Roofline tab, loop at heart_demo.cpp:278 now runs faster and takes 0.260 seconds compared to 1.310 seconds in the baseline.
Loop self time with the default ISA:

Loop self-time with Intel AVX-512:

To see Intel Advisor’s recommendation on how to vectorize not-vectorized loops, navigate to the Why No Vectorization tab under Survey & Roofline. For the scalar loop at heart_demo.cpp:332, Intel Advisor recommends forcing vectorization of the outer loop.
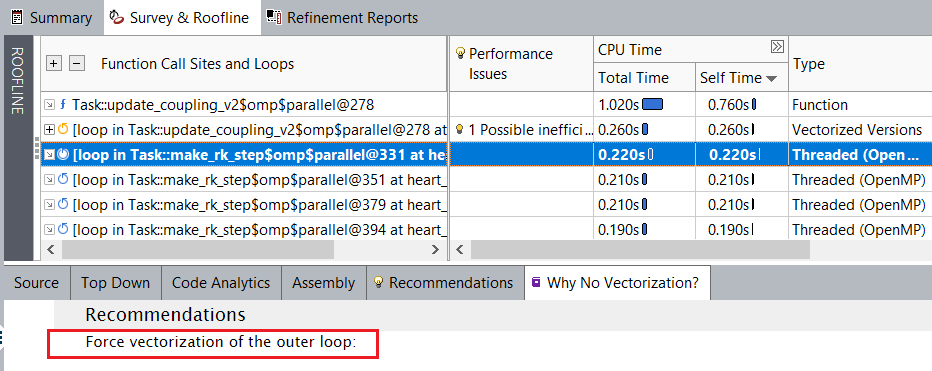
Vectorize Outer Loop
As Intel Advisor recommends, force vectorization of the outer loop at line numbers 332, 352, 366, and 380 from heart_demo.cpp.
Before forcing vectorization of the outer loop, make sure that the loop is safe to vectorize by running the Dependencies analysis:
Mark up loops at line numbers 332, 352, 366, and 380 from heart_demo.cpp.
Run the Dependencies analysis for the selected loops.
Review the result in the following report tabs:
In the Refinement Reports, Intel Advisor finds no dependencies in the outer loop so it is safe to vectorize.
In the Survey & Roofline report tab, the Trip Count column shows that the number of trip counts for the outer loops at line numbers 332, 352, 366, and 380 from heart_demo.cpp is 588. Inner loops are completely unrolled and have the trip counts of 8 only.
Since the number of trip counts for outer loops is high and Intel Advisor found no dependencies in the outer loop, you can safely add #pragma omp parallel for simd clause to the outer loop for vectorization as shown below:
#pragma omp parallel for simd
for (int i=0; i<N; i++) {
    for (int j=0; j<DynamicalSystem::SYS_SIZE; j++)
        cnodes[i].cell.Y[j] = cnodes[i].state[j] + cnodes[i].rk4[0][j]/2.0;
    cnodes[i].cell.compute(time,cnodes[i].rk4[1]);
    for (int j=0; j<DynamicalSystem::SYS_SIZE; j++)
        cnodes[i].rk4[1][j] *= dt;
}
Rebuild the application, re-run the Survey and Trip Counts and FLOP analyses, and see the result in the Survey & Roofline report.
As you can see, execution time improves after vectorizing the outer loop. For example, the loop at heart_demo.cpp:332 now runs faster and takes 3.58 seconds compared to 4.2 seconds before the optimization.
Loop execution time before outer loop vectorization:

Loop execution time after outer loop vectorization:
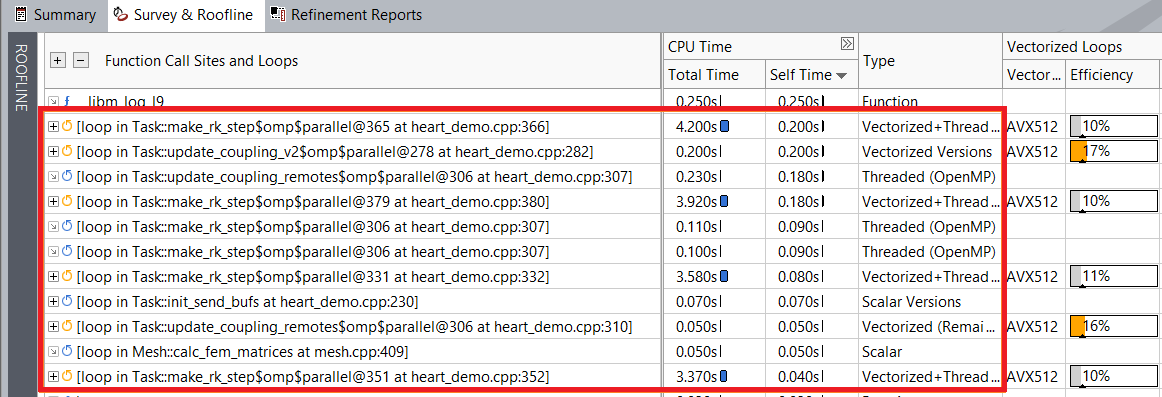
After optimization, the heart_demo application runs and completes in 18.5 seconds.
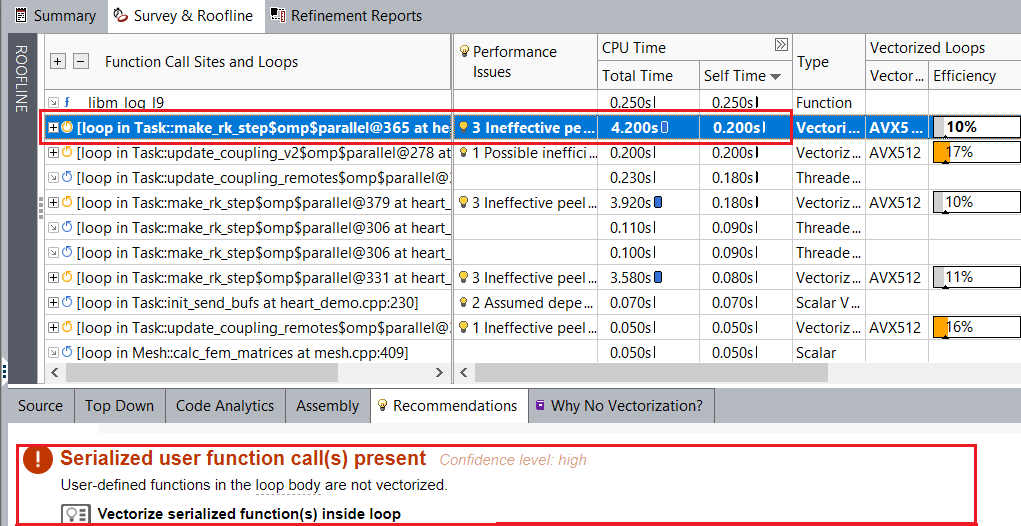
The efficiency of the vectorized outer loops is still low. Select the vectorized outer loop in the Survey & Roofline to see the recommendations for it. For example, the loop at heart_demo.cpp:366 has the Serialized user function call(s) present performance issue, and Intel Advisor suggests vectorizing serialized functions inside loop to fix it. Other vectorized outer loops at heart_demo.cpp:332, 352, and 380 have the same performance issue.
Use SIMD Function
Intel Advisor detects a serialized user function calls in the loop at heard_demo:366 and recommends to vectorize it.
Add #pragma omp declare simd to the compute function in luo_rudy_1991.hpp:
#pragma omp declare simd
void compute (double time, double *out);
The DECLARE SIMD construct enables creating SIMD versions of a specified subroutine or function. These versions can be used to process multiple arguments from a single invocation in a SIMD loop.
Rebuild the application, re-run the Vectorization and Code Insights perspective, and see the result in the Survey & Roofline report.
After optimization, the heart_demo application runs and completes in 16.4 seconds.
Optimize SIMD Usage
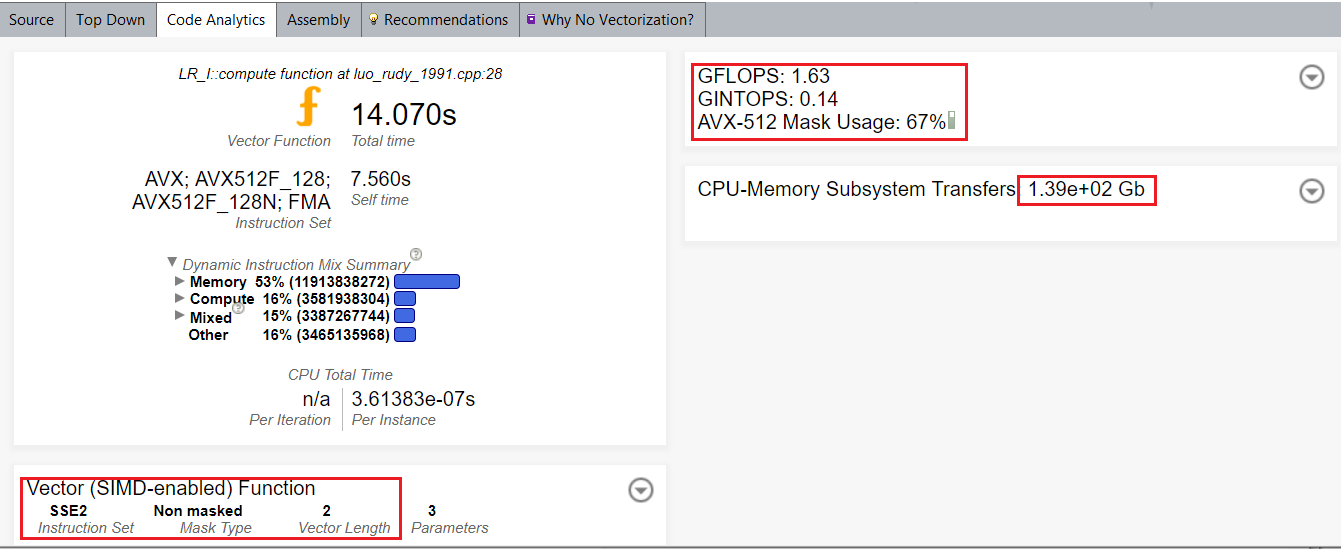
After vectorizing a function call, you can see in the Code Analytics that the vector length is 2, and Intel® Streaming SIMD Extensions 2 (Intel® SSE2) instruction set was used instead of vector length 8 and instruction set Intel AVX-512.
By default, the compiler uses the SSE instruction set. For better SIMD performance, use vecabi=cmdtarget compiler option or specify processor clause in vector function declaration.
To improve SIMD performance with the compiler option:
Add the -vecabi=cmdtarget option to the build command to generate Intel AVX-512 variant for the vectorized function and rebuild the heart_demo:
mpiicpc ../heart_demo.cpp ../luo_rudy_1991.cpp ../rcm.cpp ../mesh.cpp -g -o heart_demo -O3 -xCORE-AVX512 -qopt-zmm-usage=high -vecabi=cmdtarget -std=c++11 -qopenmp -parallel-source-info=2Re-run the Vectorization and Code Insights perspective and go to Survey & Roofline > Code Analytics to view the result.
With this change, the vector length is 8 and the instruction set is Intel AVX-512.

After optimization, the heart_demo application runs and completes in 9.2 seconds.
Disable Unroll
For the vectorized inner loop at heart_demo.cpp:310, Intel Advisor also detects a vectorized remainder loop and recommends to disable unrolling for it.
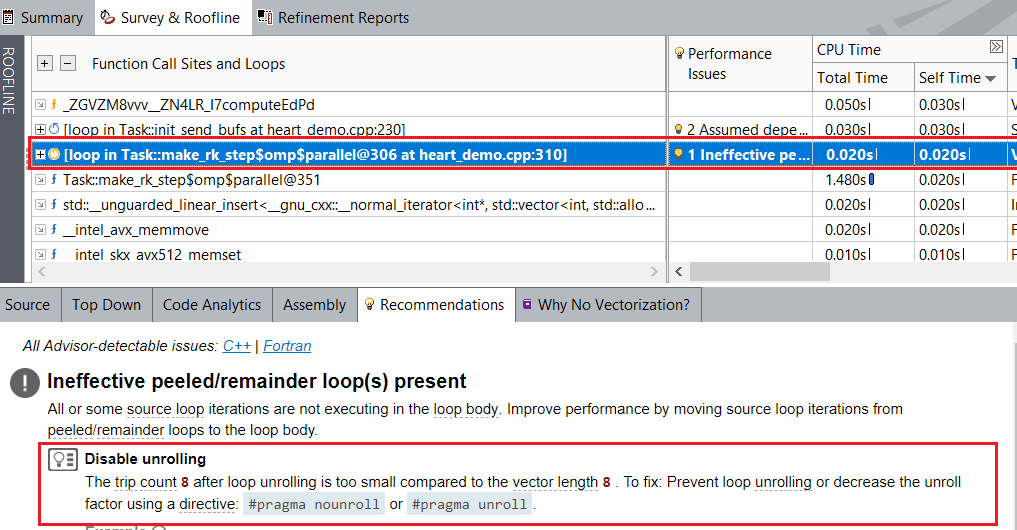
To disable unrolling:
Add #pragma nounroll to the top of the inner loop at heart_demo.cpp:310, which was vectorized as a remainder loop.
With this change, the loop is executed as a vectorized body with 100% FPU utilization compared to 36% masked utilization for the vectorization remainder.
Rebuild the application, re-run the Vectorization and Code Insights perspective, and see the result in the Survey & Roofline > Code Analytics report.
After optimization, the heart_demo application runs and completes in 8.9 seconds.
Performance Summary
The optimization methods described above resulted in an overall 2.6x improvement from baseline on a single node. The applied optimizations can improve application performance as well:
# of Nodes / # of Ranks |
Baseline Time |
Optimized Time |
Time Improvement |
|---|---|---|---|
1/48 |
22.7 seconds |
8.9 seconds |
2.55x |
2/96 |
11.5 seconds |
5.15 seconds |
2.23x |
4/192 |
6.6 seconds |
3.5 seconds |
1.88x |
You can compare the baseline and optimized results with the Roofline Compare feature and the visualize performance improvement between loops.
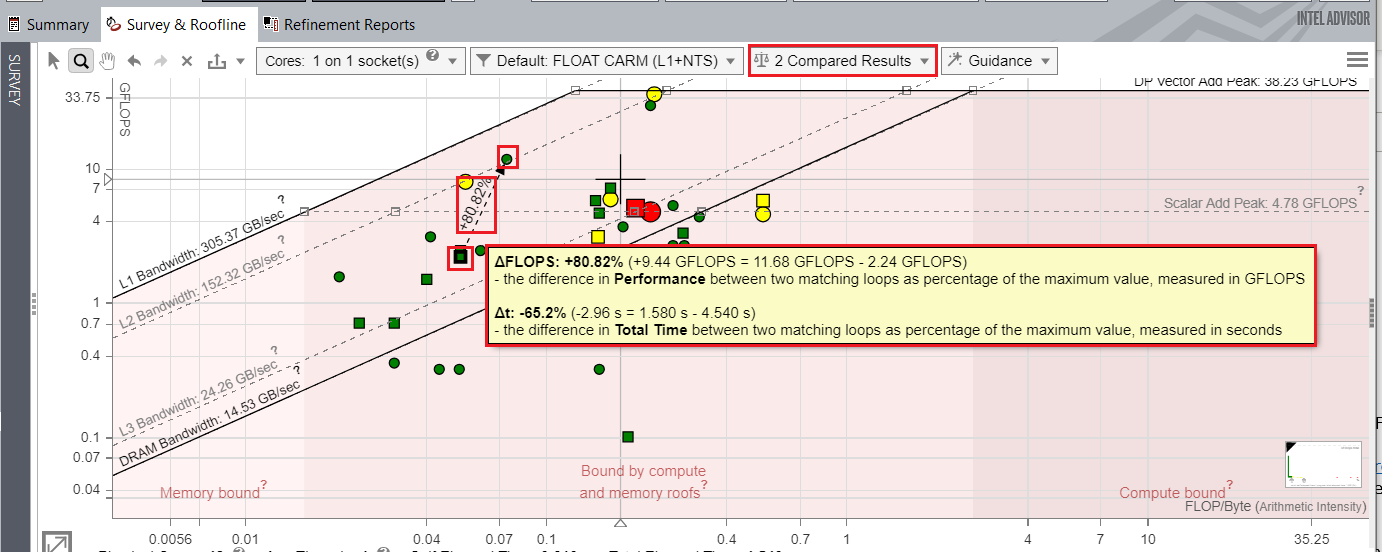
The image below compares the performance of the application before and after optimization. The Roofline chart highlights the performance difference for the loop at heart_demo.cpp:352 before and after optimizations showing the performance improvement of 80.82% with respect to FLOPS.
Next Steps
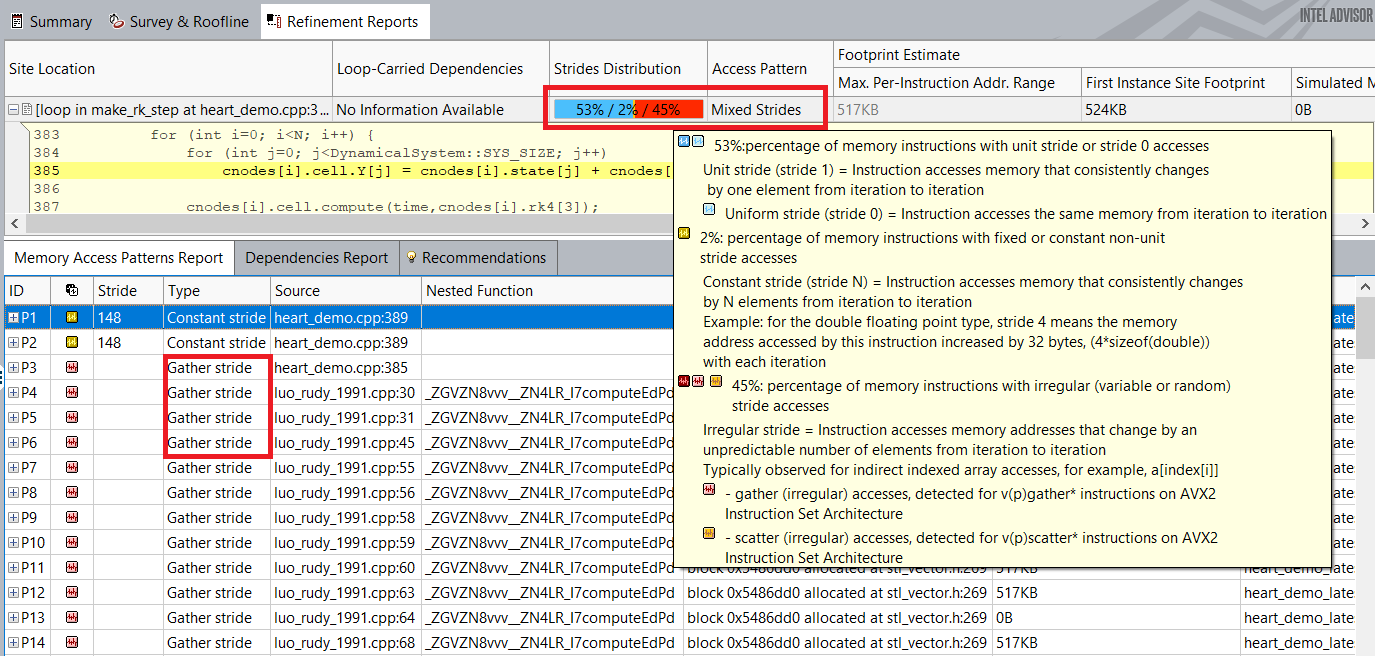
As you can see from the Roofline chart above, the vectorized loops are still far from the scalar add and vector add peak roofs. Intel Advisor recommends to run a Memory Access Patterns (MAP) analysis to identify the inefficient memory accesses in loops which may cause low vectorization efficiency.
The MAP analysis shows that these loops have almost 50% non-unit stride accesses. Changing the random stride accesses in the loops will be the next step to improve vectorization efficiency for the loop.
Key Take-Aways
To help you efficiently vectorize loops/functions of your application, Intel Advisor provides:
Recommendations that you can follow to improve performance
Insights into actual performance of the application against hardware-imposed performance ceilings by plotting a Roofline chart
Deeper analyses like Dependencies and Memory Access Patterns to gain insights into data dependencies and memory accesses in a loop
By following Intel Advisor recommendations, you improved performance of the real-time 3D cardiac electrophysiology simulation heart_demo application by 2.55x compared to the baseline results.