Analyze Performance on Cray* Systems
This section describes how to use Intel® Advisor to collect and analyze performance data from an application that runs on a Cray* system. You’ll start by building the application and setting up the Intel Advisor environment on the Cray system. Afterwards, you’ll collect performance data with the Intel Advisor command line interface (CLI), save your data as a snapshot, then interpret those results using the Intel Advisor GUI on a local system.
Collect performance data on the Cray system using the Intel Advisor CLI.
Create an Intel Advisor snapshot on the Cray system to enable data interpretation on a local system.
Interpret performance data on a local system using the Intel Advisor GUI.
Ingredients
This section lists the hardware and software used to produce the specific result shown in this recipe:
Performance analysis tools: Intel Advisor 2018
The latest version is available for download at https://software.intel.com/content/www/us/en/develop/tools/advisor/choose-download.html.
Application: miniFE, a Mantevo Open Source miniapp intended to be the best approximation to an unstructured implicit finite that includes all important computational phases
Available for download at https://github.com/Mantevo/miniFE/archive/2.2.0.tar.gz.
Compiler: Intel® C++ Compiler Classic 2018
The latest version is available for download at https://software.intel.com/content/www/us/en/develop/tools/compilers/c-compilers/choose-download.html.
Operating system: SUSE* Linux Enterprise Server 11
CPU: Intel® Xeon Phi™ 7230 processor
Prerequisites
On the Cray system:
Set up the programming environment.
Make sure the Intel programming environment is loaded by default:
$ module listIf the Cray programming environment is loaded instead, swap the programming environments:
$ module swap PrgEnv-cray PrgEnv-intel
Clone the application from https://github.com/Mantevo/miniFE/archive/2.2.0.tar.gz and expand the compressed file:
$ tar xzvf ./miniFE-2.2.0.tar.gzChange directory to the openmp version directory:
$ cd ./miniFE-2.2.0/openmp/srcEdit the Makefile.intel.openmp file and add the -g option to the CFLAGS definition:
CFLAGS = -g –O3 -qopenmpNOTE:If you use the Cray ftn or cc compiler wrappers instead of the Intel® C++ Compiler Classic, you must add the -dynamic option. ftn also detects OpenMP* pragmas, so no OpenMP* options are required.
On a local system: Set up the Intel Advisor in the usual manner.
Build the Application on the Cray System
On the Cray system: Build the application and save the resulting executable in the current directory:
$ make –f ./Makefile.intel.openmpCollect Performance Data on the Cray System Using the Intel Advisor CLI
On the Cray system:
Start an interactive session.
Use the Slurm scheduler and enable the interactive session using the salloc command. For example: Launch a 30-minute interactive session on a single node, in a partition (queue) named debug:
$ salloc -N 1 -p debug -t 30:00A prompt change reflects the new node name after the allocation is granted.
NOTE:Some Cray systems connect to a service node (also known as a MOM node) after the allocation becomes active. If this occurs, change directory again to the openmp version directory.
Set up the Intel Advisor environment:
At this time, there is no homogeneous naming scheme for the Intel Advisor Cray module. Check your system documentation for the correct name. This recipe uses advisor as a convenient placeholder:
$ module swap PrgEnv-cray PrgEnv-intel
$ module load advisor
If your center does not have a module, source the Intel Advisor setup variables in the usual manner:
$ source <advisor_install_dir>/advixe-vars.shIt may also be necessary to add the library location:
$ export LD_LIBRARY_PATH=$LD_LIBRARY_PATH:/opt/intel/advisor/lib64
Set the number of threads for the Intel Advisor Survey analysis:
$ export OMP_NUM_THREADS=32Run the Intel Advisor Survey analysis and store the result in the adv directory.
$ srun –n 1 –c 32 advixe-cl --collect=survey --project-dir=./adv -- ./miniFE.x
Alternatively, you can collect performance data on the Cray system in batch mode.
Create an Intel Advisor Snapshot on the Cray System to Enable Data Interpretation on a Local System
Intel Advisor snapshots are an excellent transferral method if post-processing nodes that enable VNC or X11 tunneling connections are unavailable.
On the Cray system:
Generate a read-only snapshot to package all necessary performance data for further investigation in an adv_snapshot.advixeexpz file in the current directory:
$ advixe-cl --snapshot --project-dir=./adv --pack --cache-sources --cache-binaries -- adv_snapshotCopy the adv_snapshot.advixeexpz file to a local system using your prefer data transfer method.
Interpret Performance Data on a Local System Using the Intel Advisor GUI
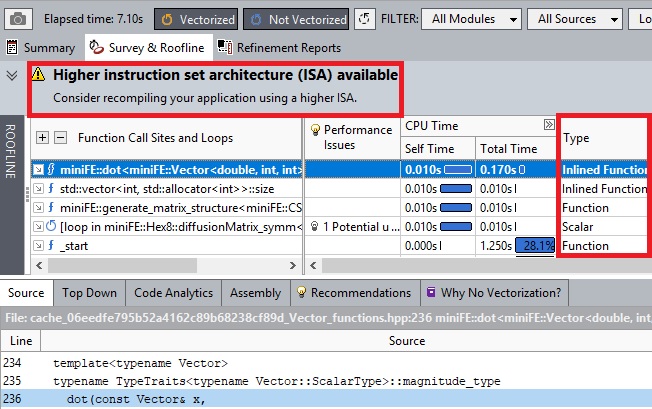
On the local system: Double-click the snapshot to launch the Intel Advisor GUI, and open the Survey report to display the collected performance data.
Expected result for the miniFE miniapp: This is a poor implementation, with no vectorized code sections and a compilation that did not use the best available Instruction Set Architecture (ISA).

Alternatively, you can interpret performance on the Cray system using an Intel Advisor CLI text report.
Alternative Steps
Collect Performance Data on the Cray System in Batch Mode (Instead of Interactively)
Create a submission script with all the configuration details. For example: Create a script named run.slurm with the following sample contents:
#!/bin/bash
#SBATCH --job-name=run_name
#SBATCH -N 1
#SBATCH -p debug
#SBATCH --ntasks-per-node=1
#SBATCH --time=00:30:00
cd $PBS_O_WORKDIR
export OMP_NUM_THREADS=32
module swap PrgEnv-cray PrgEnv-intel
module load advisor
srun –n 1 –c 32  advixe-cl --collect=survey --project-dir=./results_dir -- ./miniFE.x
Submit the script to the scheduler from a login node:
$ sbatch ./run.slurm
Interpret Performance on the Cray System Using an Intel Advisor CLI Text Report (Instead of on a Local System Using a Snapshot and the Intel Advisor GUI)
Generate a summary report that prints to screen:
$ module swap PrgEnv-cray PrgEnv-intel
$ module load advisor
$ advixe-cl --report=summary --project-dir=./adv --format=textYou can also save report output directly to file and in other formats, such as CSV and XML.
Key Take-Aways
It is possible to run the Intel Advisor on a Cray system if the Cray environment is set up correctly.
Creating a snapshot is a good way to move an Intel Advisor result to a local system that may be more responsive for interactive tasks.