Model Performance of a C++ App Ported to a GPU
This recipe shows how to check the profitability of offloading your application to a graphics processing unit (GPU) accelerator using the Offload Modeling perspective of the Intel® Advisor from the command line interface (CLI).
For the Offload Modeling perspective, the Intel Advisor runs your application on a baseline CPU or GPU and models application performance and behavior on the specified target GPU. To model application performance on a target GPU device, you can use the of the three workflows:
- CPU-to-GPU modeling for native applications (C, C++, Fortran) running on a CPU
- CPU-to-GPU modeling for SYCL, OpenMP* target, and OpenCL™ applications offloaded to a CPU
- GPU-to-GPU modeling for SYCL, OpenMP* target, and OpenCL™ applications running on a GPU
In this recipe, use the Intel Advisor CLI to analyze performance of C++ and SYCL applications with the Offload Modeling perspective to estimate the profitability of offloading the applications to the Intel® Iris® Xe graphics (gen12_tgl configuration).
Directions:
- Prerequisites.
- Explore offload opportunities.
- View the results.
- Examine performance speedup on the target GPU.
- Alternative steps.
Scenario
Offload Modeling consists of several steps depending on the workflow:
CPU-to-GPU Modeling |
GPU-to-GPU Modeling |
|---|---|
|
|
Intel Advisor allows you to run all analyses for the Offload Modeling perspective with a single command using special command line presets. You can control the analyses to run by selecting an accuracy level.
Ingredients
This section lists the hardware and software used to produce the specific result shown in this recipe:
- Performance analysis tools: Intel Advisor 2021
Available for download as a standalone and as part of the Intel® oneAPI Base Toolkit.
- Application: Mandelbrot is an application that generates a fractal image by matrix initialization and performs pixel-independent computations. There are two implementations available for download:
- A native C++ implementation MandelbrotOMP
- A SYCL implementation Mandelbrot
- Compiler:
- Intel® C++ Compiler Classic 2021 (icpc)
Available for download as a standalone and as part of the Intel® oneAPI HPC Toolkit.
- Intel® oneAPI DPC++/C++ Compiler 2021 (dpcpp)
Available for download as a standalone and as part of the Intel® oneAPI Base Toolkit.
- Intel® C++ Compiler Classic 2021 (icpc)
- Operating system: Ubuntu* 20.04.2 LTS
- CPU: Intel® Core™ i7-8559U to model CPU application performance on a target GPU (CPU-to-GPU modeling flow)
- GPU: Intel® Iris® Plus Graphics 655 to model GPU application performance on a different target GPU (GPU-to-GPU modeling flow)
You can download a precollected Offload Modeling report for the Mandelbrot application to follow this recipe and examine the analysis results.
Prerequisites
- Set up environment variables for the oneAPI tools. For example:
source /setvars.sh
- Compile the applications.
- Compile the native C++ implementation of the Mandelbrot application:
cd MandelbrotOMP/ && make - Compile the SYCL implementation of the Mandelbrot application:
cd mandelbot/ && mkdir build && cd build && cmake .. && make -j
- Compile the native C++ implementation of the Mandelbrot application:
- For the SYCL implementation of the application running on GPU: Configure your system to analyze GPU kernels.
Explore Offload Opportunities
Run the Offload Modeling collection preset with the medium accuracy.
The medium accuracy is default, so you do not need to provide any additional options to the command. To collect performance data and model application performance with medium accuracy, run one of the following commands depending on a workflow:
- To run the CPU-to-GPU modeling for the native Mandelbrot application:
advisor --collect=offload --config=gen12_tgl --project-dir=./cpu2gpu_offload_modeling -- ./release/Mandelbrot 1 - To run the GPU-to-GPU modeling for the SYCL implementation of Mandelbrot application:
advisor --collect=offload --gpu --accuracy=low --project-dir=./gpu2gpu_offload_modeling -- ./src/Mandelbrot
For the low accuracy, Intel Advisor runs the following analyses:
- Survey
- Characterization with trip count and FLOP collection, cache simulation, and data transfer modeling
- Performance Modeling
To see analyses executed for the medium accuracy, you can type the execution command with the --dry-run option:
advisor --collect=offload --config=gen12_tgl --dry-run --project-dir=./cpu2gpu_offload_modeling -- ./release/Mandelbrot 1To generate commands for the GPU-to-GPU modeling, add the --gpu option to the command above.
The commands will be printed to the terminal:
advisor --collect=survey --auto-finalize --static-instruction-mix --project-dir=./cpu2gpu_offload_modeling -- ./release/Mandelbrot 1
advisor --collect=tripcounts --flop --stacks --auto-finalize --enable-cache-simulation --data-transfer=light --target-device=gen12_tgl --project-dir=./cpu2gpu_offload_modeling -- ./release/Mandelbrot 1
advisor --collect=projection --no-assume-dependencies --config=gen12_tgl --project-dir=./cpu2gpu_offload_modeling -- ./release/Mandelbrot 1
View the Results
Intel Advisor stores the results of analyses with analysis configurations in the cpu2gpu_offload_modeling and gpu2gpu_offload_modeling directories specified with --project-dir option. You can view the collected results in several output formats.
View Result Summary in Terminal
After you run the command, the result summary is printed to the terminal. The summary contains the timings on the baseline and target devices, total predicted speedup, and the table with metrics per each of top five offload candidates with the highest speedup.
Result summary for the CPU-to-GPU modeling of the native C++ Mandelbrot application:

Result summary for the GPU-to-GPU modeling of the SYCL implementation of the Mandelbrot application:

View the Results in the Intel Advisor GUI
If you have the Intel Advisor graphical user interface (GUI) installed on your system, you can open the results there. In this case, you open the existing Intel Advisor results without creating any additional files or reports.
To open the CPU-to-GPU modeling result in Intel Advisor GUI, run this command:
advisor-gui ./cpu2gpu_offload_modelingView an Interactive HTML Report in a Web Browser
After you run the Offload Modeling using Intel Advisor CLI, an interactive HTML report is generated automatically. You can view it at any time in your preferred web browser and you do not need the Intel Advisor GUI installed.
The HTML report is generated in the <project-dir>/e<NNN>/report directory and named as advisor-report.html.
For the Mandelbrot application, the report is located in the ./cpu2gpu_offload_modeling/e000/report/. The report location is also printed in the Offload Modeling CLI output:
…
Info: Results will be stored at '/localdisk/cpu2gpu_offload_modeling/e000/pp000/data.0'. See interactive HTML report in '/localdisk/adv_offload_modeling/e000/report'
…
advisor: The report is saved in '/localdisk/cpu2gpu_offload_modeling/e000/report/advisor-report.html'.
Interactive HTML report structure is similar to the result opened in the Intel Advisor GUI. Offload Modeling report consists of several tabs that are report summary, detailed performance metrics, sources, logs.
Examine Performance Speedup on the Target GPU
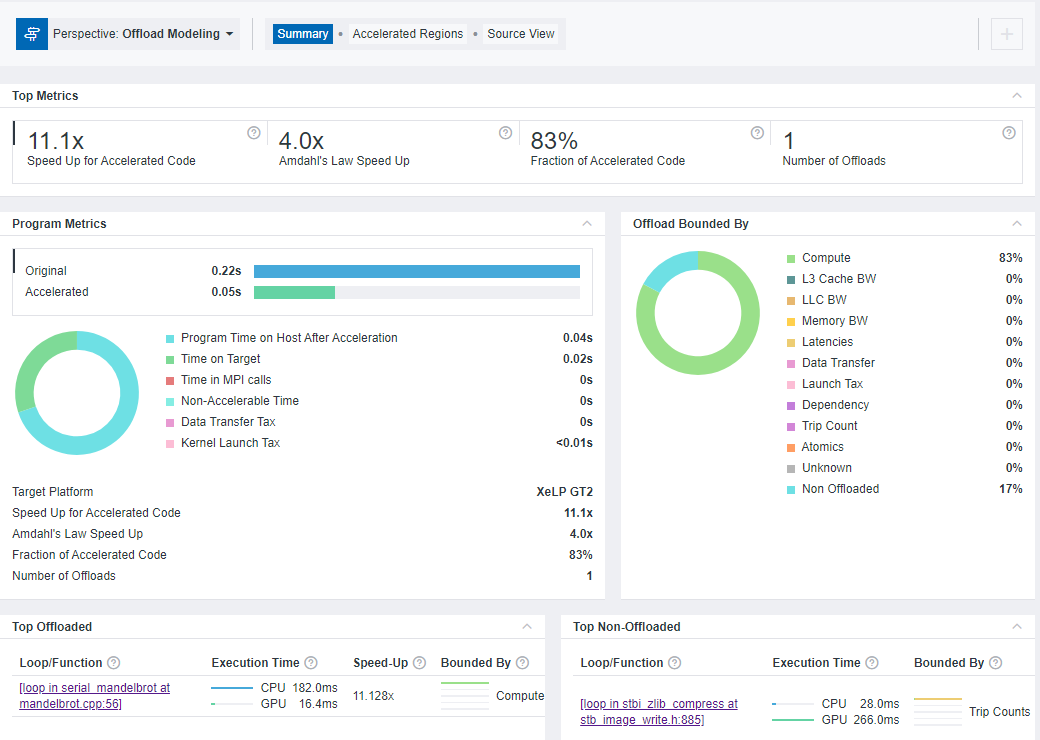
By default, the Summary tab opens first. It shows the summary of the modeling results:
- Top Metrics and Program Metrics panes show per-program performance estimations and comparison with performance on the baseline device. For the native C++ Mandelbrot application, by offloading one loop, you can achieve 11.1x the estimated speedup. The execution time on the baseline device is 0.22 seconds, and the estimated execution time on the target device is 0.05 seconds.
- Offload Bounded By pane shows factors that limit the performance of code regions. The native C++ Mandelbrot application is mostly bounded by compute.
- Top Offloaded pane shows top five regions recommended for offloading to the selected target device. For the native C++ Mandelbrot application, one loop in serial_mandelbrot at mandelbrot.cpp:56 is recommended for offloading.
- Top Non-Offloaded pane shows top five non-offloaded regions and the reasons why they are not recommended to be run on the target device. For the native C++ Mandelbrot application, one loop in stbi_zilb_compress at stb_image_write.h:885 is not recommended for offloading. Its estimated execution time on the target device is higher than the measured execution time on the baseline device.
NOTE:Data in the Top Non-Offloaded pane is available only for the CPU-to-GPU modeling workflow.

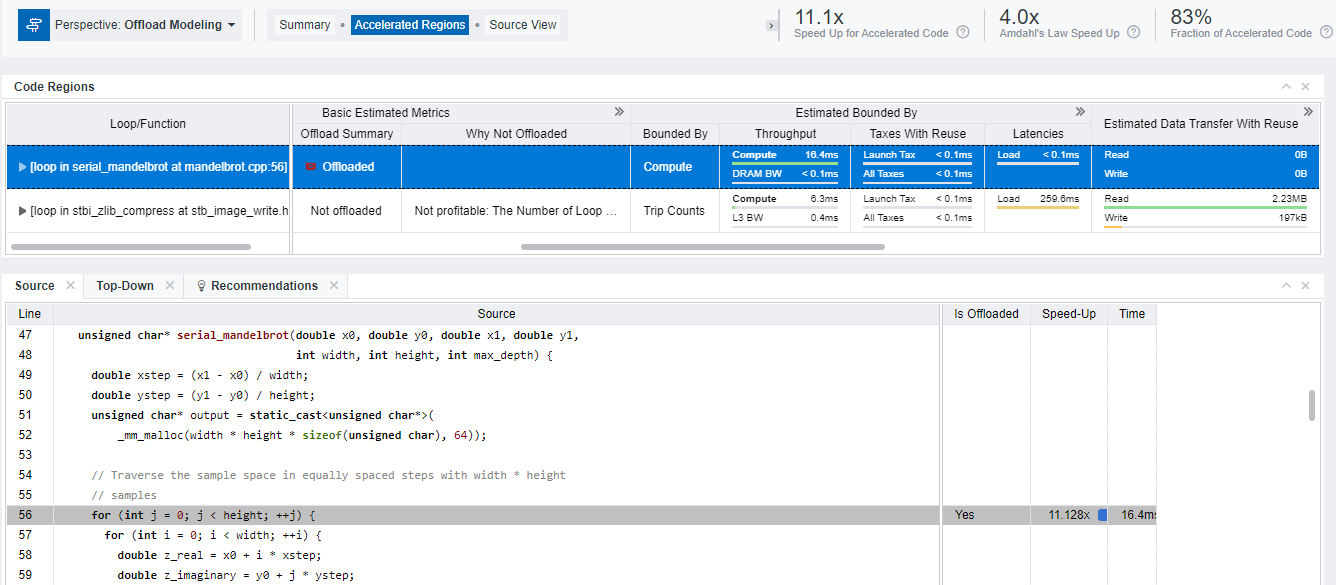
To get more details, switch to the Accelerated Regions tab.
- Examine the Code Regions table that visualizes the modeling results for each code region: it contains performance metrics measured on the baseline CPU or GPU platform and metrics estimated while modeling the application behavior on the target GPU platform. You can expand data columns and scroll the grid to see more metrics.
- View the application source code with speedup and execution time for each loop/function. Do one of the following:
- Click a region of interest in the Code Regions table and check the Source tab below the table.
- Right-click the region of interest in the Code Regions table, select View Source to switch to the Source View tab of the report where you can examine the full source code.

Alternative Steps
You can run the Offload Modeling perspective using command line collection presets with one of the accuracy levels: low, medium, or high. The higher accuracy value you choose, the higher runtime overhead is added but more accurate results are produced.
Run Offload Modeling with Low Accuracy
To collect performance data and model application performance with low accuracy, run one of the following commands depending on a workflow:
- To run the CPU-to-GPU modeling for the native Mandelbrot application:
advisor --collect=offload --config=gen12_tgl --accuracy=low --project-dir=./cpu2gpu_offload_modeling -- ./release/Mandelbrot 1 - To run the GPU-to-GPU modeling for the SYCL implementation of Mandelbrot application:
advisor --collect=offload --gpu --config=gen12_tgl --accuracy=low --project-dir=./gpu2gpu_offload_modeling -- ./src/Mandelbrot
For the low accuracy, Intel Advisor runs the following analyses:
- Survey
- Characterization with trip count and FLOP collection
- Performance Modeling
To see analysis executed for the low accuracy, you can type the execution command with the --dry-run option:
advisor --collect=offload --config=gen12_tgl --accuracy=low --dry-run --project-dir=./cpu2gpu_offload_modeling -- ./release/Mandelbrot 1To generate commands for the GPU-to-GPU modeling, add the --gpu option to the command above.
The commands will be printed to the terminal:
advisor --collect=survey --auto-finalize --static-instruction-mix --project-dir=./cpu2gpu_offload_modeling -- ./release/Mandelbrot 1
 advisor --collect=tripcounts --flop --stacks --auto-finalize --target-device=gen12_tgl --project-dir=./cpu2gpu_offload_modeling -- ./release/Mandelbrot 1
 advisor --collect=projection --no-assume-dependencies --config=gen12_tgl --project-dir=./cpu2gpu_offload_modeling -- ./release/Mandelbrot 1
Run Offload Modeling with High Accuracy
To collect performance data and model application performance with high accuracy, run one of the following commands depending on a workflow:
- To run the CPU-to-GPU modeling for the native Mandelbrot application:
advisor --collect=offload --config=gen12_tgl --accuracy=high --project-dir=./cpu2gpu_offload_modeling -- ./release/Mandelbrot 1 - To run the GPU-to-GPU modeling for the SYCL implementation of Mandelbrot application:
advisor --collect=offload --gpu --config=gen12_tgl --accuracy=high --project-dir=./gpu2gpu_offload_modeling -- ./src/Mandelbrot
For the low accuracy, Intel Advisor runs the following analyses:
- Survey
- Characterization with trip count and FLOP collection, cache simulation, and data transfer modeling with attributing memory objects and tracking accesses to stack memory
- Dependencies
- Performance Modeling
Note: The Dependencies analysis is only relevant to the CPU-to-GPU modeling.
To see analyses executed for the high accuracy, you can type the execution command with the --dry-run option:
advisor --collect=offload --config=gen12_tgl --accuracy=high--dry-run --project-dir=./cpu2gpu_offload_modeling -- ./release/Mandelbrot 1To generate commands for the GPU-to-GPU modeling, add the --gpu option to the command above.
The commands will be printed to the terminal:
advisor --collect=survey --auto-finalize --static-instruction-mix --project-dir=./cpu2gpu_offload_modeling -- ./release/Mandelbrot 1
advisor --collect=tripcounts --flop --stacks --auto-finalize --enable-cache-simulation --data-transfer=medium --target-device=gen12_tgl --project-dir=./cpu2gpu_offload_modeling -- ./release/Mandelbrot 1
advisor --collect=dependencies --filter-reductions --loop-call-count-limit=16 --select=markup=gpu_generic --project-dir=./cpu2gpu_offload_modeling -- ./release/Mandelbrot 1
advisor --collect=projection --config=gen12_tgl --project-dir=./cpu2gpu_offload_modeling -- ./release/Mandelbrot 1
Key Take-Aways
- You can use different Offload Modeling perspective workflows depending on your application:
- Run the CPU-to-GPU modeling to analyze native C, C++, Fortran applications running on a CPU or SYCL, OpenMP target, OpenCL™ applications offloaded to a CPU.
- Run the GPU-to-GPU modeling to analyze SYCL, OpenMP* target, OpenCL™ applications running on a GPU.
- To run the Offload Modeling perspective from CLI, you can use one of the command line collection presets. The presets allow you to run the perspective with a specific accuracy level using a single command.