Estimate the C++ Application Speedup on a Target GPU
This recipe illustrates how to check if your C++ application is profitable to be offloaded to a target GPU device using Intel® Advisor.
- Prerequisites.
- Compile the C++ Mandelbrot sample.
- Run Offload Modeling without Dependencies analysis.
- View estimated performance results.
- Run Offload Modeling with Dependencies analysis.
- Rewrite the code in SYCL.
- Compare estimations and real performance on GPU.
Scenario
Offload Modeling workflow includes the following two steps:
Collect application characterization metrics on CPU: run the Survey analysis, the Trip Counts and FLOP analysis, and optionally, the Dependencies analysis.
Based on the metrics collected, estimate application execution time on a graphics processing unit (GPU) using an analytical model.
Information about loop-carried dependencies is important for application performance modeling because only parallel loops can be offloaded to GPU. Intel Advisor can get this information from an Intel Compiler, an application callstack tree, and/or based on the Dependencies analysis results. The Dependencies analysis is the most common way, but it adds high overhead to performance modeling flow.
In this recipe, we will first run the Offload Modeling assuming that the loops do not contain dependencies and then will verify this by running the Dependencies analysis for the profitable loops only.
There are three ways to run the Offload Modeling: from the Intel Advisor graphical user interface (GUI), from the Intel Advisor command line interface (CLI), or using Python* scripts delivered with the product. This recipe uses the CLI to run analyses and the GUI to view and investigate the results.
Ingredients
This section lists the hardware and software used to produce the specific result shown in this recipe:
Performance analysis tools: Intel® Advisor 2021
Available for download at https://software.intel.com/content/www/us/en/develop/articles/oneapi-standalone-components.html as a standalone and at https://software.intel.com/content/www/us/en/develop/tools/oneapi/base-toolkit/download.html as part of the Intel® oneAPI Base Toolkit.
Application: Mandelbrot is an application that generates a fractal image by matrix initialization and performs pixel-independent computations.
There are two implementations available for download:
A native C++ implementation, which you can analyze with Offload Modeling
A SYCL implementation, which you can run on a GPU and compare its performance with the Intel Advisor predictions
NOTE:Select a device to run the application on by setting the SYCL_DEVICE_TYPE=<CPU|GPU|FPGA|HOST> environment variable.
Compiler: Intel® C++ Compiler Classic 2021 and Intel® oneAPI DPC++/C++ Compiler 2021
Available for download as part of the Intel® oneAPI HPC Toolkit at https://software.intel.com/content/www/us/en/develop/tools/oneapi/hpc-toolkit/download.html.
Operating system: Microsoft Windows* 10 Enterprise
CPU: Intel® Core™ i7-8665U processor
GPU: Intel® UHD Graphics 620 (Gen9 GT2 architecture configuration)
Prerequisites
Set up environment variables for the tools:
<oneapi-install-dir>\setvars.bat
Compile the C++ Mandelbrot Sample
Consider the following when compiling the C++ version of the Mandelbrot sample:
The benchmark code consists of the main source file mandelbrot.cpp, which performs computations, and several helper files main.cpp and timer.cpp. You should include all three source files into the target executable.
Use the following recommended options when compiling the application:
/O2 to request moderate optimization level and optimize code for maximum speed
/Zi to enable debug information required for collecting characterization metrics
See details about other recommended options in the Intel Advisor User Guide.
Run the following command to compile the C++ version of the Mandelbrot sample:
icx.exe /Qm64 /Zi /nologo /W3 /O2 /Ob1 /Oi /D NDEBUG /D _CONSOLE /D _UNICODE /D UNICODE /EHsc /MD /GS /Gy /Zc:forScope /Fe"mandelbrot_base.exe" /TP src\main.cpp src\mandelbrot.cpp src\timer.cppFor details about Intel C++ Compiler Classic options, see Intel® C++ Compiler Classic Developer Guide and Reference.
Run Offload Modeling without Dependencies Analysis
First, get rough performance estimations using a special operating mode of the performance model that ignores potential loop-carried dependencies. In the CLI, use the --no-assume-dependencies command line option to activate this mode.
To model the Mandelbrot application performance on the target GPU with the Gen9 GT2 configuration:
Run Survey analysis to get baseline performance data:
advisor --collect=survey --stackwalk-mode=online --static-instruction-mix --project-dir=.\advisor_results --search-dir sym=.\x64\Release --search-dir bin=.\x64\Release --search-dir src=. -- .\x64\Release\mandelbrot_base.exeRun Trip Counts and FLOP analysis to get call count data and model cache for the Gen9 GT2 configuration:
advisor --collect=tripcounts --flop --stacks --enable-cache-simulation --data-transfer=light --target-device=gen9_gt2 --project-dir=.\advisor_results --search-dir sym=.\x64\Release --search-dir bin=.\x64\Release --search-dir src=. -- .\x64\Release\mandelbrot_base.exeModel application performance on the GPU with the Gen9 GT2 configuration ignoring assumed dependencies:
advisor --collect=projection --config=gen9_gt2 --no-assume-dependencies --project-dir=.\advisor_resultsThe --no-assume-dependencies option allows to minimize the estimated time and assumes a loop is parallel without dependencies.
The collected results are stored in the advisor_results project that you can open in the GUI.
View Estimated Performance Results
To view the results in the GUI:
Run the following from the command prompt to open the Intel Advisor:
advisor-guiGo to File > Open > Project..., navigate to the advisor_results project directory where you stored results, and open the .advixeproj project file.
If the Offload Modeling report does not open, click Show Result on the Welcome pane.
The Summary results collected for the advisor_results project should open.
If you do not have the Intel Advisor GUI or need to check the results briefly before copying them to a machine with the Intel Advisor GUI, you can open an HTML report located at .\advisor_results\e000\pp000\data.0\report.html. See Identify Code Regions to Offload to GPU and Visualize GPU Usage for more information about the HTML report.
Explore Offload Modeling Summary
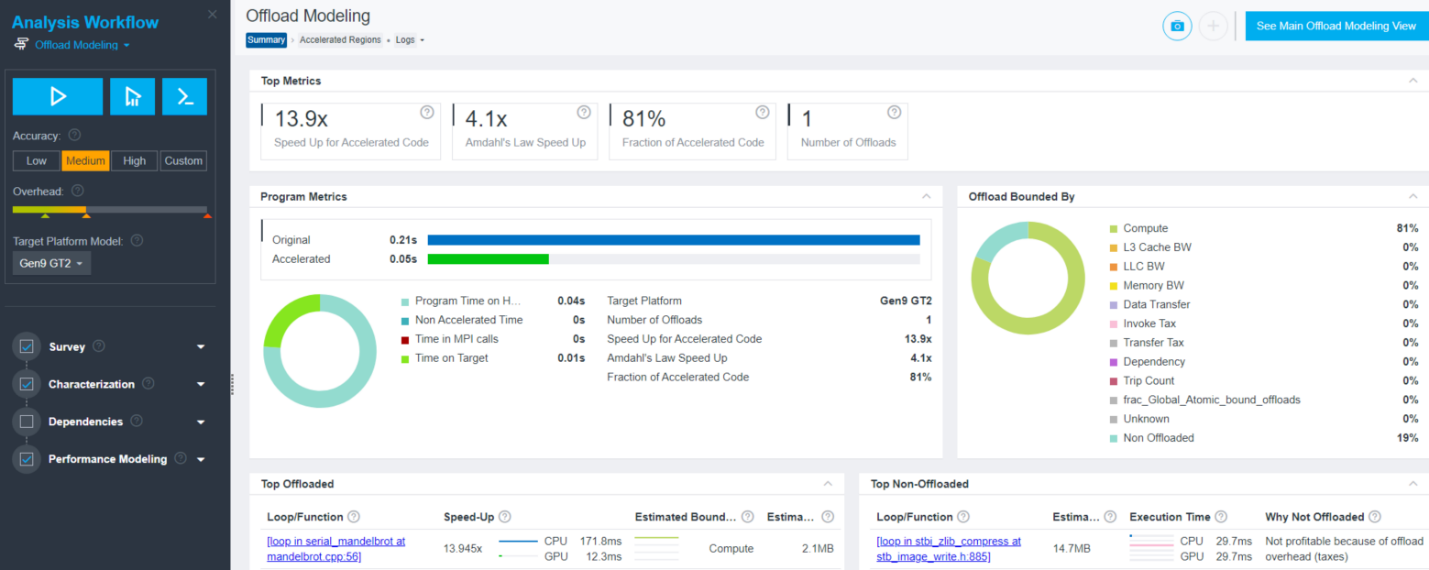
The Summary tab of the Offload Modeling report shows modeling results in several views:
In the Top Metrics and Program Metrics panes, review per-program performance estimations and comparison with the baseline application performance on CPU.
In the Offload Bounded By pane, review characterization metrics and factors that limit the performance of regions in relation to their execution time.
In the Top Offloaded pane, review top five regions recommended for offloading to the selected target device.
In the Top Non-Offloaded pane, review top five non-offloaded regions and the reasons why they are not recommended to be run on the target.

For the Mandelbrot application, consider the following data:
The estimated execution time on the target GPU is 0.05 s.
The loop at mandelbrot.cpp:56 is recommended to be offloaded to the GPU.
Its execution time is 81% of the total execution time of the whole application (see Fraction of Accelerated Code).
If this loop runs on the target GPU, it is executed 13.9 times faster than on the CPU (see Speed Up for Accelerated Code).
If this loop is offloaded, the whole application runs 4.1 times faster, according to the Amdahl’s Law (see Amdahl’s Law Speed Up).
The loop at stb_image_write.h:885 is not profitable for offloading because the overhead for offloading it to the GPU is high.
Explore Accelerated Regions Report
To open the full Offload Modeling report, do one of the following:
Click the Accelerated Regions tab at the top of the report.
Click a loop/function name hyperlink in the Top Offloaded or in Top Non-Offloaded pane.
Accelerated Regions report shows details about all offloaded and non-offloaded code regions. Review the data reported in the following panes:
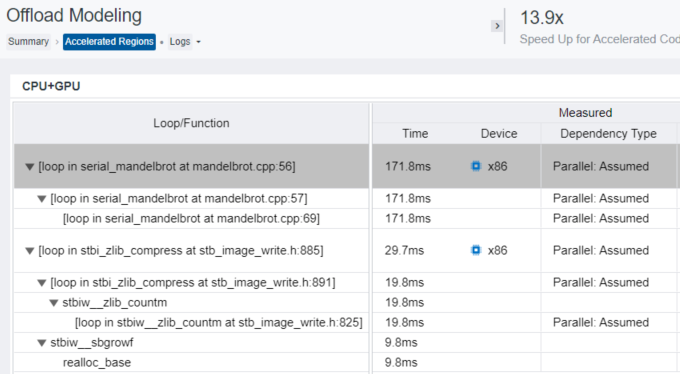
The CPU+GPU table shows the result of modeling execution of each code region on the GPU: it reports performance metrics measured on the baseline CPU platform and metrics estimated for application performance modeled on the target GPU, such as expected execution time and what a bottleneck is (for example, if a code region is compute or memory bound). You can expand data columns and scroll the grid to see more projected metrics.
For the Mandelbrot application, the loop at mandelbrot.cpp:56 is recommended for offloading to the GPU. It is compute bound and its estimated execution time on the Gen9 GT2 GPU is 12.3 ms. This region transfers 2.1 MB of data, mostly from GPU to CPU (write data transfers), but it does not add overhead since the GPU is integrated.

Click the mandelbrot.cpp:56 code regions in the CPU+GPU table to see its source code in the Source view with several offload parameters.

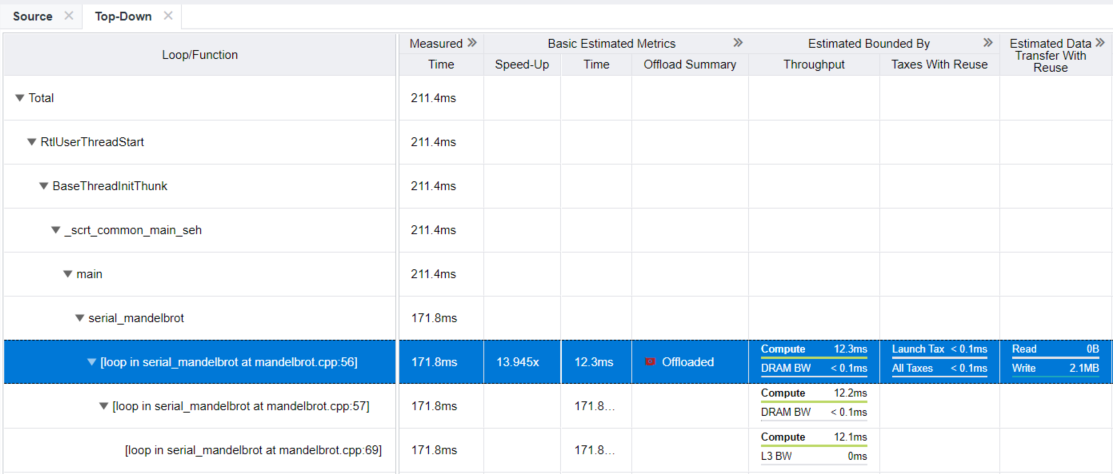
Switch to the Top-Down tab to locate the mandelbrot.cpp:56 region in the application call tree. Use this pane to review the loop metrics together with its callstack.

Run Offload Modeling with Dependencies Analysis
The Dependencies analysis detects loop-carried dependencies, which do not allow to parallelize the loop and offload it to GPU. At the same time, this analysis is slow: it adds a high runtime overhead to your target application execution time making it 5-100x slower. Run the Dependencies analysis if your code might not be effectively vectorized or parallelized.
In the CPU+GPU table, expand the loop at mandelbrot.cpp:56 to see its child loops.
Expand the Measured column group.
The Dependency Type column reports Parallel: Assumed for the mandelbrot.cpp:56 and its child loops. This means that Intel Advisor marks these loops as parallel because you used the --no-assume-dependencies option for the performance modeling, but it does not have information about their actual dependency type.
 NOTE:If you are sure that loops in your application are parallel, you can skip the Dependencies analysis. Such loops should have a Parallel: <reason> value in the Dependency Type column, where <value> is Explicit, Proven, Programming Model, or Workload.
To check if the loops have real dependencies, run the Dependencies analysis.
To minimize the Dependencies analysis overhead, select the loops with the Parallel: Assumed value to check their dependency type, for example, using loop IDs. Run the following command to get IDs of those loops:
advisor --report=survey --project-dir=.\advisor_results -- .\x64\Release\mandelbrot_base.exeThis command prints the Survey analysis results with loop IDs to the command prompt. The mandelbrot.cpp:57 and mandelbrot.cpp:56 loops have IDs 2 and 3.

Run the Dependencies analysis with the --mark-up-list=2,3 option to analyze only the loops of interest:
advisor --collect=dependencies --mark-up-list=2,3 --loop-call-count-limit=16 --filter-reductions --project-dir=.\advisor_results -- .\x64\Release\mandelbrot_base.exe
Rerun the performance modeling to get the refined performance estimation:
advisor --collect=projection --config=gen9_gt2 --project-dir=.\advisor_resultsOpen the advisor_results projects with refined results in the GUI:
advisor-gui .\advisor_results
In the Accelerated Regions report, the loop at mandelbrot.cpp:56 and its child loops have the Parallel: Workload value in the Dependency Type column. This means that Intel Advisor did not find loop-carried dependencies and these loops can be offloaded and executed on the GPU.
Rewrite the Code in SYCL
Now you can rewrite the code region at mandelbrot.cpp:56, which Intel Advisor recommends to execute on the target GPU using the SYCL programming model.
The SYCL code should include the following actions:
Selecting a device
Declaring a device queue
Declaring a data buffer
Submitting a job to the device queue
Executing the calculation in parallel
The resulting code should look like the following code snippet from the SYCL version of Mandelbrot sample
using namespace sycl;
// Create a queue on the default device. Set SYCL_DEVICE_TYPE environment
// variable to (CPU|GPU|FPGA|HOST) to change the device
queue q(default_selector{}, dpc_common::exception_handler);
// Declare data buffer
buffer data_buf(data(), range(rows, cols));
// Submit a command group to the queue
q.submit([&](handler &h) {
// Get access to the buffer
auto b = data_buf.get_access(h,write_only);
// Iterate over image and write to data buffer
h.parallel_for(range<2>(rows, cols), [=](auto index) {
…
b[index] = p.Point(c);
});
    });
Make sure your SYCL code (mandel.hpp in the SYCL sample) contains the same values of image parameters as the C++ version:
constexpr int row_size = 2048;
constexpr int col_size = 1024;
See SYCL page and oneAPI GPU Optimization Guide for more information.
Compare Estimations and Real Performance on GPU
Compile the Mandelbrot sample as follows:
dpcpp.exe /W3 /O2 /nologo /D _UNICODE /D UNICODE /Zi /WX- /EHsc /MD /I"$(ONEAPI_ROOT)\dev-utilities\latest\include" /Fe"mandelbrot_dpcpp.exe" src\main.cppRun the compiled mandelbrot application:
mandelbrot_dpcpp.exeReview the application output printed to the command prompt. It reports application execution time:
Parallel time: 0.0121385s
Mandelbrot calculation in the offloaded loop takes 12.1 ms on the GPU. This is close to the 12.3 ms execution time predicted by the Intel Advisor.
Key Take-Aways
Offload Modeling feature of the Intel Advisor can help you to design and prepare your application for executing on a GPU before you have the hardware. It can model your application performance on a selected GPU, calculate potential speedup and execution time, identify offload opportunities, and locate potential bottlenecks on the target hardware.
Loops with dependencies cannot be executed in parallel and offloaded to a target GPU. When modeling application performance with the Intel Advisor, you can select to ignore potential dependencies or consider all potential dependencies. You can run the Dependencies analysis to get more accurate modeling results if your application might not be effectively vectorized or parallelized.