A newer version of this document is available. Customers should click here to go to the newest version.
HOW: Analysis Types
Intel® VTune™ Profiler provides a set of pre-configured analysis types you may start with to address your particular performance optimization goals.
When you create a project, VTune Profiler opens the Configure Analysis window that prompts you to specify WHAT you want to analyze (an application, process, or a whole system), a system WHERE you plan to run the analysis, and select HOW you need to run the analysis.
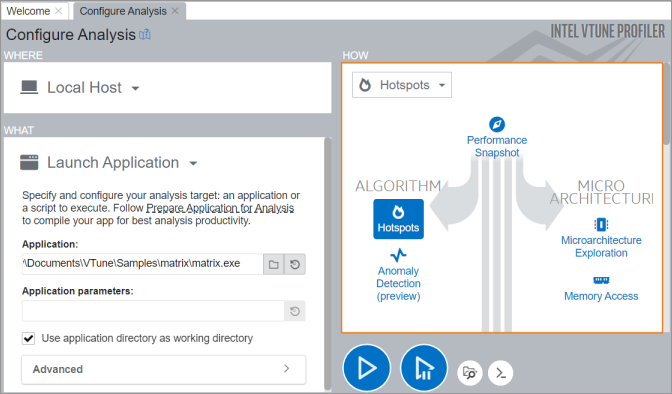
Click the header in the HOW pane to open an analysis tree. Select from an analysis type from one of these groups:
Performance Snapshot analysis:
- Use Performance Snapshot to get an overview of issues that affect the performance of an application on your system. The analysis is a good starting point that recommends areas for deeper focus. You also get guidance on other analysis types to consider running next.
Algorithm analysis:
Use the Hotspots analysis type to investigate call paths and find where your code is spending the most time. Identify opportunities to tune your algorithms. See Finding Hotspots tutorial: Linux | Windows.
Use Anomaly Detection (preview) to identify performance anomalies in frequently recurring intervals of code like loop iterations. Perform fine-grained analysis at the microsecond level.
Memory Consumption is best for analyzing memory consumption by your app, its distinct memory objects, and their allocation stacks. This analysis is supported for Linux targets only.
Microarchitecture analysis:
Microarchitecture Exploration (formerly known as General Exploration) is best for identifying the CPU pipeline stage (front-end, back-end, and so on) and hardware units responsible for your hardware bottlenecks.
Memory Access is best for memory-bound apps to determine which level of the memory hierarchy is impacting your performance by reviewing CPU cache and main memory usage, including possible NUMA issues.
Parallelism analysis:
Threading is best for visualizing thread parallelism on available cores, locating causes of low concurrency, and identifying serial bottlenecks in your code.
Use HPC Performance Characterization to understand how your compute-intensive application is using the CPU, memory, and floating point unit (FPU) resources. See Analyzing an OpenMP* and MPI Application tutorial: Linux.
I/O analysis:
Input and Output analysis monitors utilization of the IO subsystems, CPU and processor buses.
Accelerators analysis:
GPU Offload (preview) is targeted for applications using a Graphics Processing Unit (GPU) for rendering, video processing, and computations. It helps you identify whether your application is CPU or GPU bound.
GPU Compute/Media Hotspots (preview) is targeted for GPU-bound applications and helps analyze GPU kernel execution per code line and identify performance issues caused by memory latency or inefficient kernel algorithms.
CPU/FPGA Interaction analysis explores FPGA utilization for each FPGA accelerator and identifies the most time-consuming FPGA computing tasks.
Platform analysis:
System Overview is a driverless event-based sampling analysis that monitors a general behavior of your target system and identify platform-level factors that limit performance.
VTune Profiler-Platform Profiler:
Use VTune Profiler-Platform Profiler to get a holistic view of system behavior. You can then perform system characterization on a deployed system that runs a full load over an extended period of time.
With VTune Profiler-Platform Profiler, you can get insights into these aspects:
- Platform configuration
- Utilization
- Performance
- Imbalances related to compute, memory, storage, IO, and interconnects
A PREVIEW FEATURE may or may not appear in a future production release. It is available for your use in the hopes that you will provide feedback on its usefulness and help determine its future. Data collected with a preview feature is not guaranteed to be backward compatible with future releases.
Advanced users can create a custom analysis using the data collectors provided by VTune Profiler, or combining the collector of VTune Profiler with another custom collector.