Get a Performance Overview with Application Performance Snapshot
The first step in analyzing a hybrid MPI/OpenMP* application is getting an overview of the application performance. There is a tool called Application Performance Snapshot that can provide the general performance information about your application. This includes MPI and OpenMP time and load balance information, information about memory and disk usage, most utilized MPI operations, and more.
Run Application Performance Snapshot Analysis
Application Performance Snapshot is distributed as part of Intel® VTune™ Profiler and is tightly integrated with Intel® MPI Library.
To analyze the heart_demo application, follow these steps:
Set up the environment for MPS:
$ source <parallel_studio_installdir>/intel64/bin/mpsvars.sh
$ source <parallel_studio_installdir>/performance_snapshots/apsvars.sh
where <parallel_studio_installdir> is the installed location of Intel Parallel Studio (default location is /opt/intel).
Run the heart_demo application with the Application Performance Snapshot analysis enabled. Use 2 MPI processes per node and 64 OpenMP threads per process (the best combination).
$ export OMP_NUM_THREADS=64 # set number of OpenMP threads
$ export MPS_STAT_DIR_POSTFIX=_initial # set postfix for MPS results directory
$ mpirun -n 16 -ppn 2 -f hosts.txt aps ./heart_demo -m ../mesh_mid -s ../setup_mid.txt -t 50
The aps_result_<date> directory with the statistics data is created.
Analyze the statistics data with the Application Performance Snapshot and generate an HTML report:
$ aps-report aps_result_<date> -O report_initial.html
Open the resulting report_initial.html file to study the application performance issues.
Interpret Application Performance Snapshot Result Data
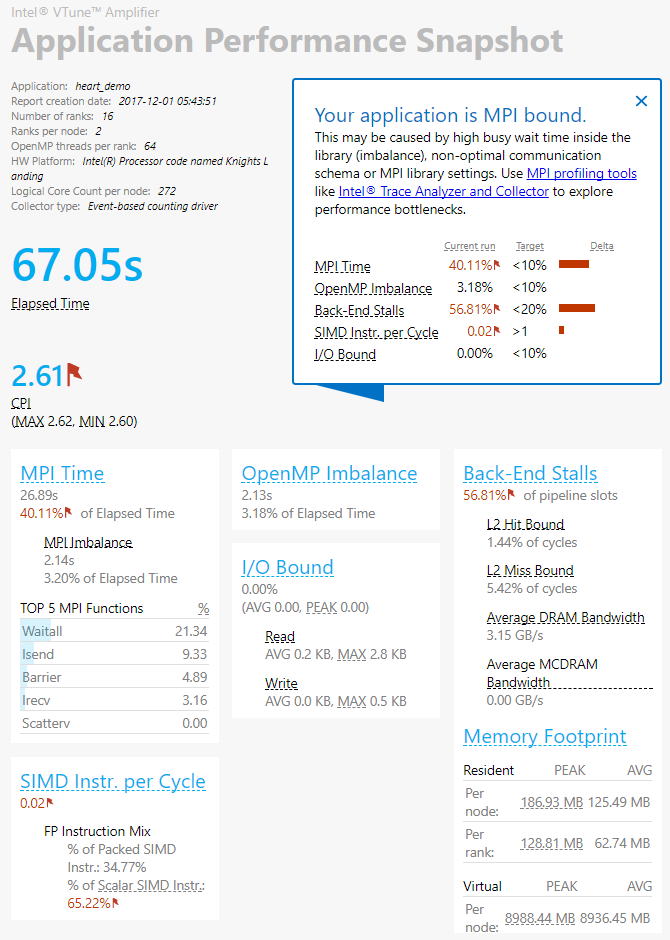
The figure below shows the resulting analysis report:

The application spends a considerable amount of time in MPI calls, which is typically not a good sign. The general recommendation is to reduce the MPI time as much as possible to allow the application to do more computation work. In this particular case, the MPI time is relatively high and the application is MPI-bound, so it is worth exploring further. For more detailed MPI analysis, use the Intel® Trace Analyzer and Collector. The tool can reveal the application communication pattern, which will enable you to easily identify its weakest spots.
Key Take-Away
Use the Application Performance Snapshot HTML report to identify high-level performance issues for your hybrid OpenMP/MPI application and to get further guidance.