Analyze Vector Instruction Set with Intel® VTune™ Profiler
Use Intel® VTune™ Profiler to understand why the computation time of the 2/64 combination is worse than the 32/4 combination even though the elapsed time is much less. A lower elapsed time for 32/4 is not possible due to the overhead of MPI deployments. As a result, it is better to focus on improving the computation time for the 2/64 combination instead.
To analyze the application performance with VTune Profiler:
Set up the Analysis: Determine the process on which the analysis should be run.
Run the Collection: The -gtool option is used in a command line for mpirun execution to run the HPC Performance Characterization analysis type in VTune Profiler.
View and Analyze the Results: Open the results file in the VTune Profiler GUI to identify specific issues with the application.
Rebuild the Application: Rebuild the application using an updated vector instruction set.
Check Application Performance: Run the application again with both configuration options to see how performance has improved.
Set Up Analysis
Rather than collecting performance data for the entire application, the data should be collected on the process with the lowest MPI time. The process with the lowest MPI time is the slowest due to high computation time, which is the target for improvement.
Use the -t option for Application Performance Snapshot to view the MPI Time per Rank data.
$ aps-report stat_second -t
Find the rank with the lowest MPI Time value. In this example, it is process number 7.
Run the Collection
Set up the environment for the Intel VTune Profiler:
$ source <vtune_installdir>/vtune-vars.sh
where <vtune_installdir> is the installed location of Intel VTune Profiler (default location is /opt/intel/vtune_profiler_<version>).
Launch the application using VTune Profiler and the appropriate rank number.
$ export OMP_NUM_THREADS=64
$ mpirun -n 16 -ppn 2 -f hosts.txt -gtool "vtune -collect hpc-performance -data-limit=0 -r result_init:7" ./heart_demo -m ../mesh_mid -s ../setup_mid.txt -i -t 50
NOTE:Replace the rank number in the second command with the rank identified in the previous section. In this example command, the rank value is 7.
The following options are included in the command:
- -gtool option is used to launch tools such as Intel VTune Profiler (vtune) on specified ranks. Additional information about the option is available from the Intel® MPI Library Developer Reference for Linux* OS at https://software.intel.com/en-us/mpi-developer-reference-linux.
- vtune is an Intel VTune Profiler command line interface with the following options used to run the analysis:
- -collect option specifies the analysis type being run on the application. Additional information about the option is available from the Intel VTune Profiler help at https://software.intel.com/en-us/amplifier_help_linux.
- -data-limit option is used to disable the size limit for result files when set to 0.
- -r option specifies the name and location of the results file.
The application launches and performance data collection begins. The data collection stops as soon as the application completes and the collected data is saved in a result file.
View and Analyze the Results
After running the performance analysis, launch Intel VTune Profiler and open the result file using the following command:
$ vtune-gui result_init.<host>/result_init.<host>.vtune &
Start analysis with the Summary window. Hover over the question mark icons
 to read the pop-up help and better understand what each performance metric means.
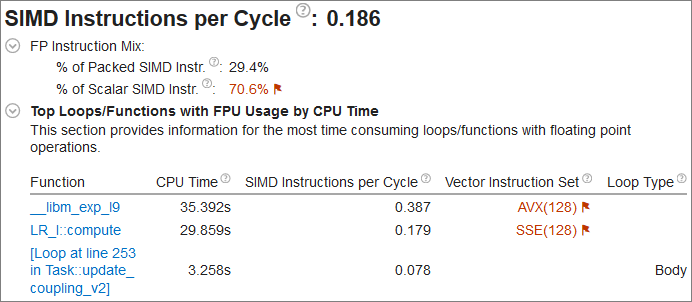
Notice that the SIMD Instructions per Cycle section indicates that the application could have better vectorization. The Vector Instruction Set column shows that the vector instruction set values are outdated (AVX, SSE). The same information can be seen in the Bottom-up window.
Rebuild Application with New Instruction Set
The application currently uses legacy instruction sets (SSE, AVX, SSE2). The instruction set has been updated to use AVX512 by adding the -xMIC-AVX512 option to the existing build script. Run the following to rebuild the application using a new instruction set:
$ mpiicpc ../heart_demo.cpp ../luo_rudy_1991.cpp ../rcm.cpp ../mesh.cpp -g -o heart_demo -O3 -xMIC-AVX512 -std=c++11 -qopenmp -parallel-source-info=2
Check Application Performance
Run the application without any analysis tool to review the improvement in computation time and elapsed time.
$ time run_ppn2_omp64.sh
$ time run_ppn32_omp4.sh
The following table shows the results as an example:
Combination (OpenMP/MPI) |
Computation Time |
Elapsed Time |
|---|---|---|
2/64 |
16.32 |
32.54 |
32/4 |
15.37 |
45.17 |
These results show that the computation time for 2 processes per node and 64 OpenMP threads per process improved from over 19 seconds down to just over 16 seconds. It also shows a minor improvement in elapsed time. Check the parallelism of the updated code next.
Key Take-Away
Using legacy vector instruction sets can lead to inefficient application performance. Be sure to use the latest vector instruction sets for your application.