Analyzing the Performance of an OpenMP* and MPI Application
Use Intel® Parallel Studio XE Cluster Edition to understand the cause of ineffective code in a hybrid application by performing a series of steps in a workflow. This tutorial guides you through these workflow steps while using a sample OpenMP* and MPI application, heart_demo, which simulates electrophysiological heart activity.
|
|
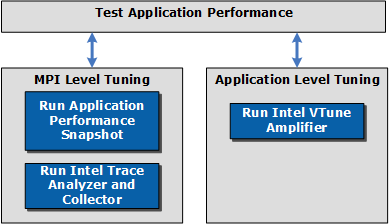
Step 2: Get a Performance Overview with Application Performance Snapshot |
|
Step 3: Identify Communication Issues with Intel Trace Analyzer and Collector |
|
|
|
Step 5: Analyze Vector Instruction Set with Intel VTune Profiler |
|
Step 6: Analyze Serial and Parallel Code Efficiency with Intel VTune Profiler |
|