Tutorial: Analyze Common Performance Bottlenecks using Intel VTune Profiler in a C++ Sample Application - Linux* OS
Analyze Memory Access
At this stage in the Tutorial, you run the Memory Access analysis to understand the main bottleneck behind slow application performance.
To understand the exact mechanics behind the memory access problems in the multiply1 loop, run the Memory Access analysis.
Run Memory Access Analysis

To run the Memory Access analysis:
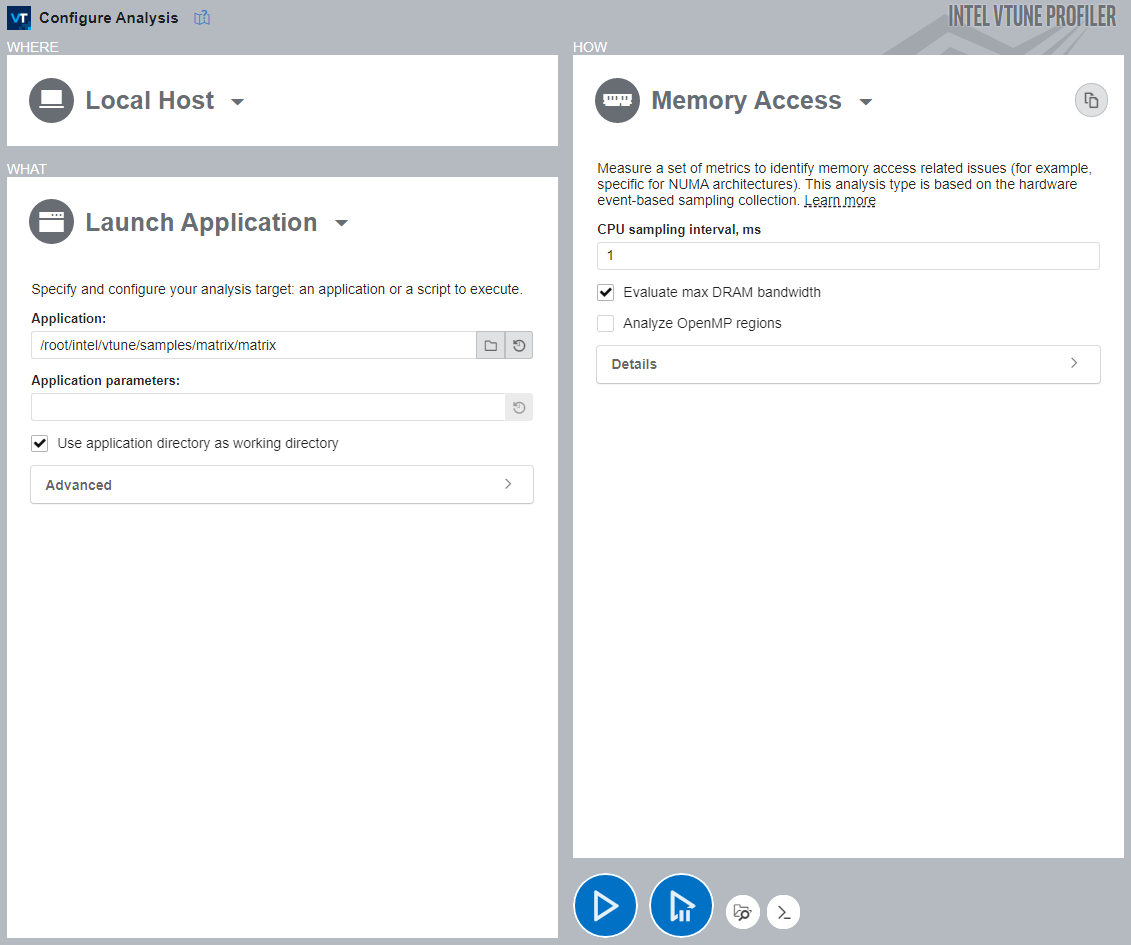
Click the Memory Access icon in the previously collected Performance Snapshot result or click the Configure Analysis button in the main toolbar.
If you clicked the Memory Access analysis icon, the Memory Access analysis should be pre-selected. If not, select this analysis type in the HOW pane.
In the HOW pane, disable the Analyze OpenMP regions option as it is not required for this application.
Click the Start button to run the analysis.
Interpret Memory Access Data
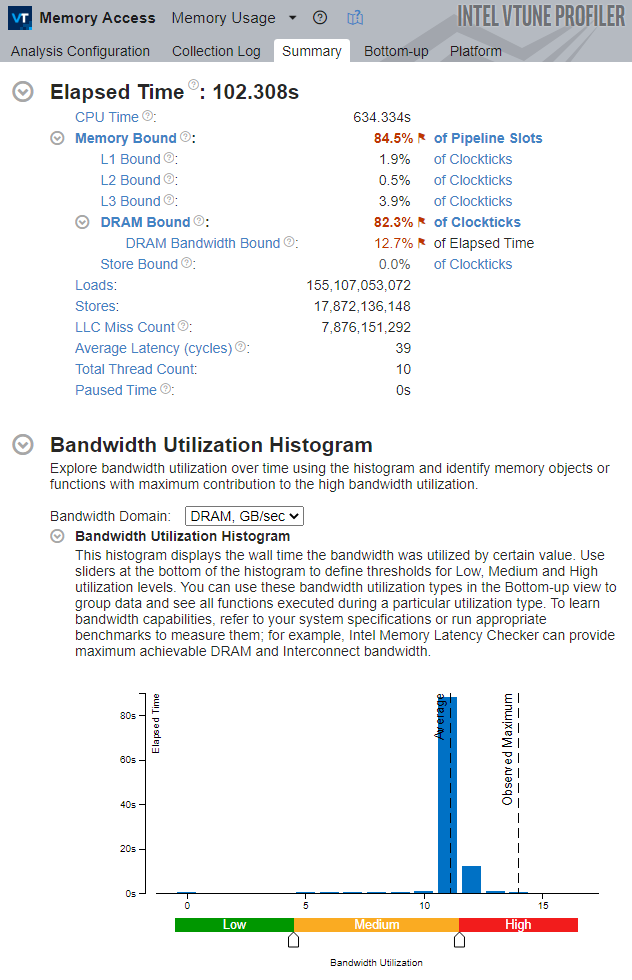
Once the sample application exits, Intel® VTune™ Profiler finalizes the result and opens the Summary viewpoint.

Once again, note that the application is severely bound by memory accesses. The fact that the system is not bound by the DRAM Bandwidth alone indicates that the application is bound by frequent, but small, requests to memory, rather than by the saturated physical DRAM Bandwidth.
Switch to the Bottom-up tab to see the exact metrics for the multiply1 function.

The multiply1 function is at the top of the grid with the highest CPU Time and high Memory Bound metric values.
Note that the LLC Miss Count metric is very high. This indicates that the application uses a cache-unfriendly memory access pattern, which causes the processor to frequently miss the LLC and request data from DRAM, which is expensive in terms of latency.
A good way to resolve this issue is to apply the loop interchange technique, which, in this case, changes the way the rows and columns of the matrices are addressed in the main loop. This way, the inefficient memory access pattern is eliminated, enabling the processor to make better use of the LLC.
Next step: Resolve Memory Access Issue.