Tutorial: Analyze Common Performance Bottlenecks using Intel VTune Profiler in a C++ Sample Application - Linux* OS
Interpret Performance Snapshot Result Data
At this point in the Tutorial, interpret the Performance Snapshot analysis result to identify main problem areas in the application.
When the sample application exits, Intel® VTune™ Profiler finalizes the result and opens the Summary tab of the Performance Snapshot analysis result.
Understand the Performance Snapshot Summary Tab
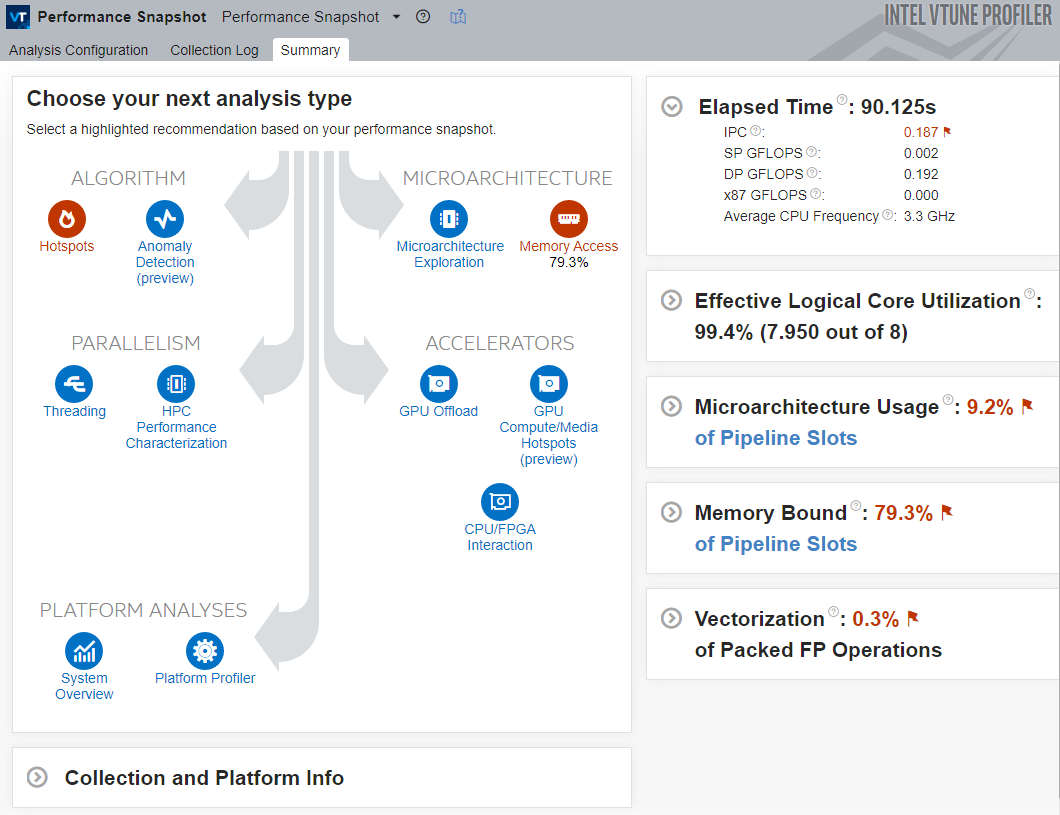
The Performance Snapshot result Summary tab shows the following:
Analysis tree: Performance Snapshot offers other analysis types that may be useful for a deeper investigation into the performance issues found in your application. Analysis types that are related to performance problems detected in your application are highlighted in red.
You can estimate the severity of each problem by studying the metric values.
Hover over an analysis type icon to understand how an analysis type is related to your performance problem.
Metrics Panes: these panes show the high-level metrics that contribute most to estimating application performance. Problematic areas are highlighted in red. You can expand each pane to get more information on each problem area and to see the lower-level metrics that contributed to the verdict.
Hover over each metric to see the metric description.
- Collection and Platform Info: this pane shows the information about the system on which this particular result was collected. It is useful when opening results collected on a different hardware platform.
Identify Problem Areas
In this case, observe these main indicators that highlight the performance bottlenecks:
The Elapsed Time for this application is very high.
The Memory Bound metric is high, indicating a memory access problem. Due to this, Performance Snapshot highlights the Memory Access analysis as a potential starting point and indicates that this performance bottleneck is the most severe and contributes most to the total Elapsed Time.
The IPC (Instructions per Cycle) metric value is very low for a modern superscalar processor, indicating that the processor is stalled for most of the time.
The Performance Snapshot analysis highlights the Hotspots analysis as a good starting point. In general, the Hotspots analysis is a good candidate for a first in-depth analysis. It highlights hotspots, or areas of code that contributed most to the elapsed time.
Start with the Hotspots analysis to see which area of code in the matrix application contributes most to the performance problem.
Next step: Run and Interpret Hotspots Analysis.