Example: Profile a SYCL* Application on Windows*
Profile a sample matrix_multiply SYCL application with Intel® VTune™ Profiler. Get familiar with the product and understand the statistics collected for GPU-bound applications.
Prerequisites
- Make sure you have Microsoft* Visual Studio (v2017 or newer) installed on your system.
- Install Intel VTune Profiler from the Intel® oneAPI Base Toolkit or the Intel® System Bring-up Toolkit. These toolkits contain the Intel® oneAPI DPC++/C++ Compiler (icpx -fsycl) compiler which is necessary for the profiling process.
- Set up environment variables. Execute the vars.bat script located in the <vtune-install-dir>\env directory.
- Ensure that the Intel oneAPI DPC++ Compiler (installed with the Intel® oneAPI Base toolkit) is integrated into Microsoft Visual Studio.
- Compile the code using the -gline-tables-only and -fdebug-info-for-profiling options for Intel oneAPI DPC++ Compiler.
- Set up your system for GPU analysis.
For information on installing Intel VTune Profiler in the Microsoft* Visual Studio environment, see the VTune Profiler User Guide.
Build the Matrix App
Download the matrix_multiply_vtune code sample package for Intel oneAPI toolkits. This contains the sample which you can use to build and profile a SYCL application.
- Open Microsoft* Visual Studio.
- Click File > Open > Project/Solution. Find the matrix_multiply_vtune folder and select matrix_multiply.sln.
- Build this configuration (Project > Build).
- Run the program (Debug > Start Without Debugging).
To choose a DPC++ or threaded version of the sample, use preprocessor definitions.
- Go to Project Properties > DPC++ > Preprocessor > Preprocessor Definition.
- Define icpx -fsycl or USE_THR.
Run GPU Analysis
Run a GPU analysis on the Matrix sample.
From the Visual Studio toolbar, click the
 Configure Analysis button.
 The Configure Analysis window opens. By default, it inherits your VS project settings and specifies the matrix_multiply.exe as an application to profile.
- In the Configure Analysis window, click the
 Browse button in the HOW pane.
 - Select the GPU Compute/Media Hotspots analysis type from the Accelerators group in the Analysis Tree.
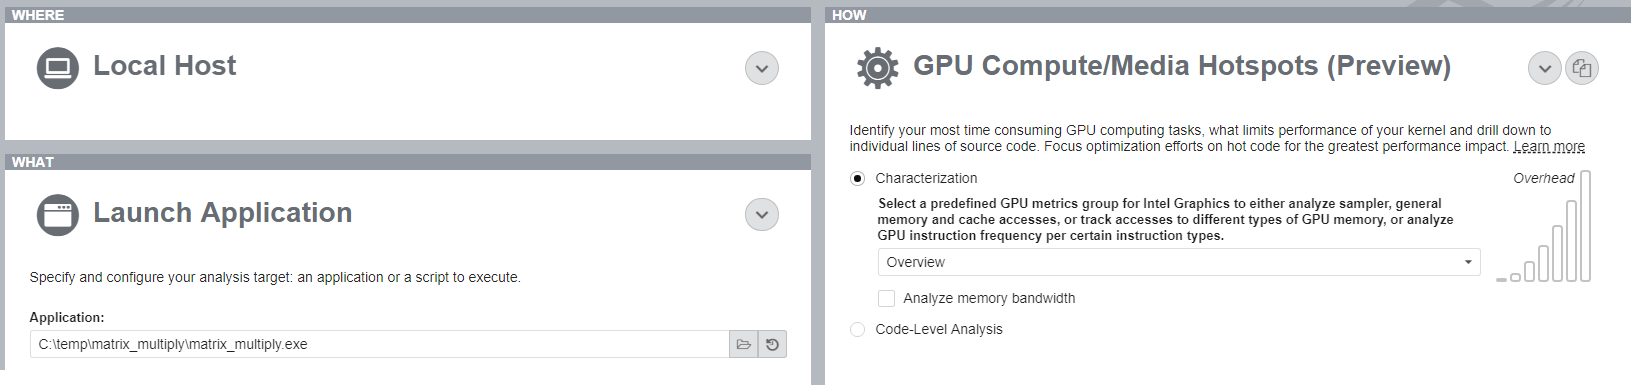
Click the Start button to launch the analysis with the predefined options.
Run GPU Analysis from Command Line:
Open the sample directory:
<sample_dir>\VtuneProfiler\matrix_multiply_vtune
In this directory, open a Visual Studio* project file named matrix_multiply.sln
The multiply.cpp file contains several versions of matrix multiplication. Select a version by editing the corresponding #define MULTIPLY line in multiply.hpp
Build the entire project with a Release configuration.
This generates an executable called matrix_multiply.exe.
Prepare the system to run a GPU analysis. See Set Up System for GPU Analysis.
Set VTune Profiler environment variables by running the batch file:
export <install_dir>\env\vars.bat
Run the analysis command:
vtune.exe -collect gpu-offload -- matrix_multiply.exe
VTune Profiler collects data and displays analysis results in the GPU Compute/Media Hotspots viewpoint. In the Summary window, see statistics on CPU and GPU resource usage to understand if your application is GPU-bound. Switch to the Graphics window to see basic CPU and GPU metrics representing code execution over time.