Example: Profile a SYCL* Application on Linux*
Use VTune Profiler with a sample matrix_multiply SYCL application to quickly get familiar with the product and statistics collected for GPU-bound applications.
Prerequisites
- Install the Intel® oneAPI DPC++/C++ Compiler from the Intel® oneAPI Base Toolkit.
- Set up environment variables by executing the vars.sh script in install-dir, which is
$HOME/intel/oneapi/ when installed with user permissions;
/opt/intel/oneapi/ when installed with root permissions.
- Set up your system for GPU analysis.
Build the Matrix Application
Download the matrix_multiply_vtune code sample package for Intel oneAPI toolkits. This contains the sample which you can use to build and profile a SYCL application.
To profile a SYCL application, make sure to compile the code using the -gline-tables-only and -fdebug-info-for-profiling Intel oneAPI DPC++ Compiler options.
To compile this sample application, do the following:
Go to the sample directory.
cd <sample_dir/VTuneProfiler/matrix_multiply_vtune/src>
- The multiply.cpp file in the src folder contains several versions of matrix multiplication. Select a version by editing the corresponding #define MULTIPLY line in multiply.hpp.
Build the app using the existing Makefile:
cmake .
make
This should generate a matrix.icpx -fsycl executable.
Run GPU Analysis
Run a GPU analysis on the Matrix sample.
- Launch VTune Profiler with the vtune-gui command.
- Click New Project from the Welcome page.
- Specify a name and location for your sample project and click Create Project.
- In the WHAT pane, browse to the matrix.icpx -fsycl file.
In the HOW pane, click the
 Browse button and select GPU Compute/Media Hotspots analysis from the Accelerators group in the Analysis Tree.
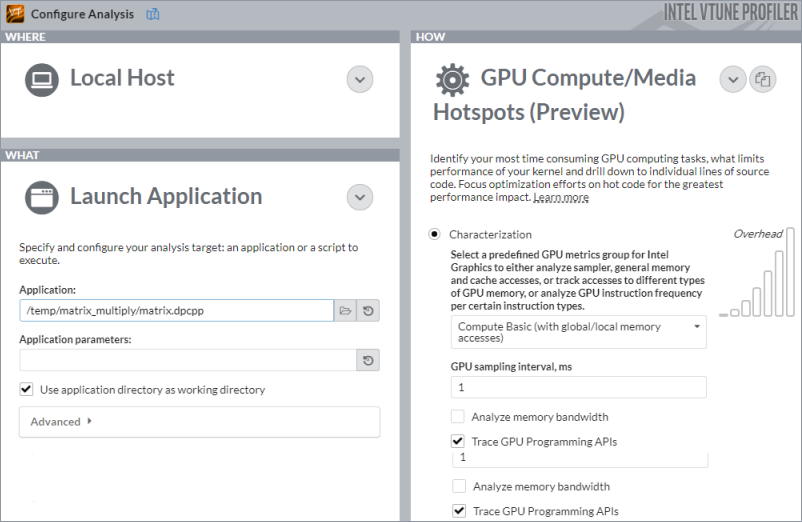
Click the Start button at the bottom to launch the analysis with the pre-selected options.
Run GPU Analysis from Command Line:
Prepare the system to run a GPU analysis. See Set Up System for GPU Analysis.
Set up environment variables for Intel software tools:
source $ONEAPI_ROOT/setvars.sh
Run the GPU Compute/Media Hotspots analysis:
vtune -collect gpu-hotspots -r ./result_gpu-hotspots -- ./matrix.icpx -fsycl
To see the summary report, type:
vtune -report summary -r ./result_gpu-hotspots
VTune Profiler collects data and displays analysis results in the GPU Compute/Media Hotspots viewpoint. In the Summary window, see statistics on CPU and GPU resource usage to understand if your application is GPU-bound. Switch to the Graphics window to see basic CPU and GPU metrics representing code execution over time.