Example: Profile an OpenMP Application on Linux*
Use Intel VTune Profiler on a Linux machine to profile a sample iso3dfd_omp_offload OpenMP application offloaded onto an Intel GPU. Learn how to run a GPU analysis and examine results.
Prerequisites
- Make sure your system is running Linux* OS kernel 4.14 or a newer version.
- Use Gen 9 or a newer version of Intel® Processor Graphics.
- Your system should be running on 10th Generation Intel® Core™ i7 Processors (code name Ice Lake) or a newer Intel processor.
- For the Linux GUI, use:
- GTK+ version 2.10 or newer (2.18 and newer versions are recommended)
- Pango version 1.14 or newer
- X.Org version 1.0 or newer (1.7 and newer versions are recommended)
- Download the Intel® oneAPI DPC++/C++ Compiler (available in the Intel® oneAPI Base Toolkit). You need this compiler to profile OpenMP applications.
- Set up environment variables. Execute the vars.sh script in install-dir, which is
$HOME/intel/oneapi/ when installed with user permissions;
/opt/intel/oneapi/ when installed with root permissions.
- Set up your system for GPU analysis.
Build and Compile the OpenMP Offload Application
Download the iso3dfd_omp_offload OpenMP Offload sample.
Open the src directory.
cd <sample_dir>/DirectProgramming/C++/StructuredGrids/iso3dfd_omp_offload/src
Compile the OpenMP Offload application.
mkdir build;
cmake -DVERIFY_RESULTS=0 ..
make -j
This generates a src/iso3dfd executable.
Run a GPU Analysis on the OpenMP Offload Application
You are now ready to run the GPU Offload Analysis on the OpenMP application you compiled.
Open VTune Profiler and click on New Project to create a project.
On the welcome page, click on Configure Analysis to set up your analysis.
- Select these settings for your analysis.
- In the WHERE pane, select Local Host.
- In the WHAT pane, select Launch Application and specify the iso3dfd_omp_offload binary as the application to profile.
- In the HOW pane, select the GPU Offload analysis type from the Accelerators group in the Analysis Tree.
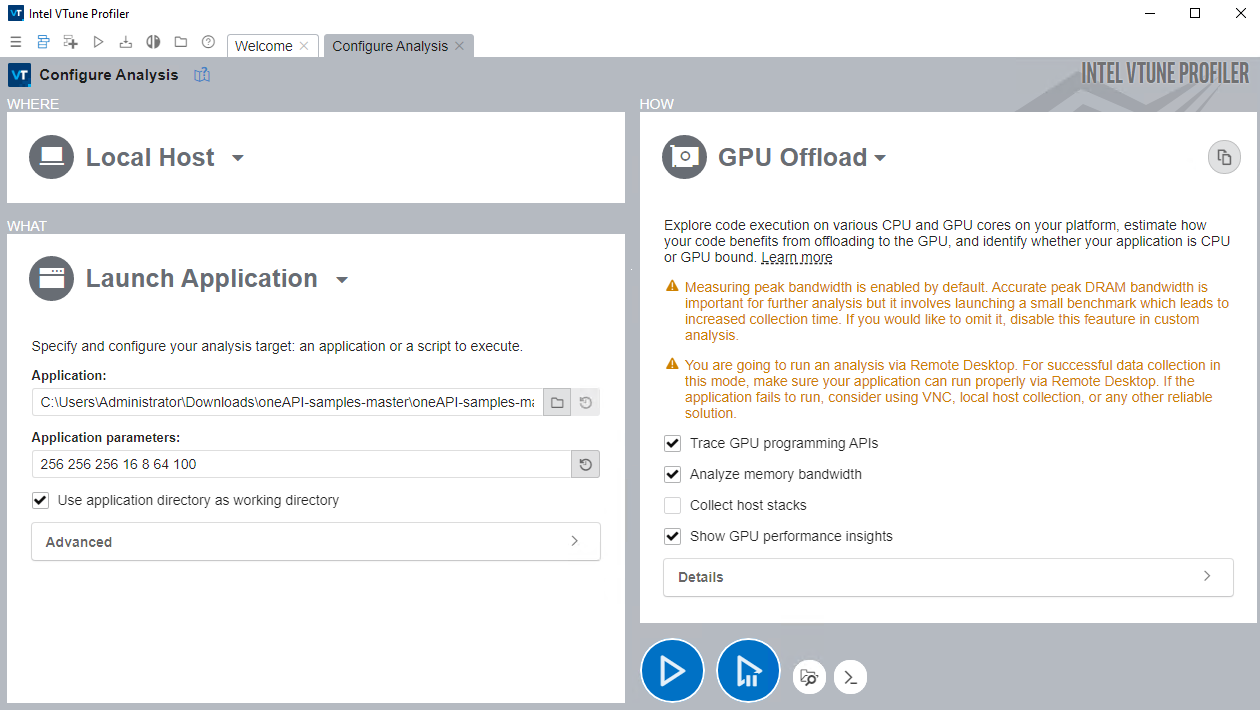
Click the Start button to run the analysis.
VTune Profiler collects data and displays analysis results in the GPU Offload viewpoint.
- In the Summary window, see statistics on CPU and GPU resource usage. Use this data to determine if your application is:
- GPU-bound
- CPU-bound
- Utilizing the compute resources of your system inefficiently
- Use the information in the Platform window to see basic CPU and GPU metrics.
- Investigate specific computing tasks in the Graphics window.