AN 943: Thermal Modeling for Intel® Stratix® 10 FPGAs with the Intel® FPGA Power and Thermal Calculator
6.8.1. Analyzing 1U Sled with 3 FPGAs

In this 3-FPGA system, the first two FPGAs have static functions that do not change with time, and the third FPGA’s power image can change with various applications. To determine the maximum power image of the third FPGA, we must determine its effective ΨCA and ambient temperature.
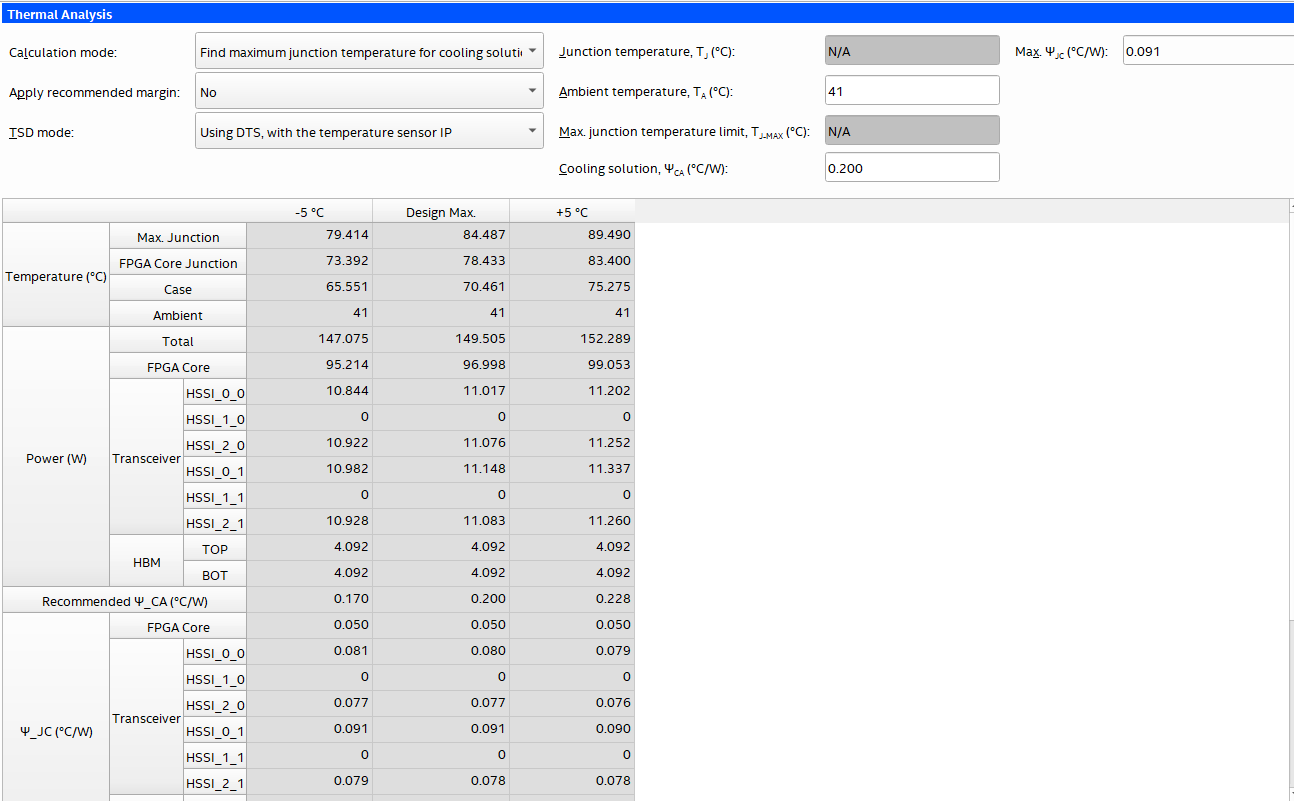
The following figure shows the PTC Thermal page for this design, with core die power of 99 watts and total FPGA power of 152 watts.
If we conduct the CFD simulation of this system three times, with core powers of 76 watts, 99 watts, and 124 watts, we get the following graph of FPGA total power versus case temperature.
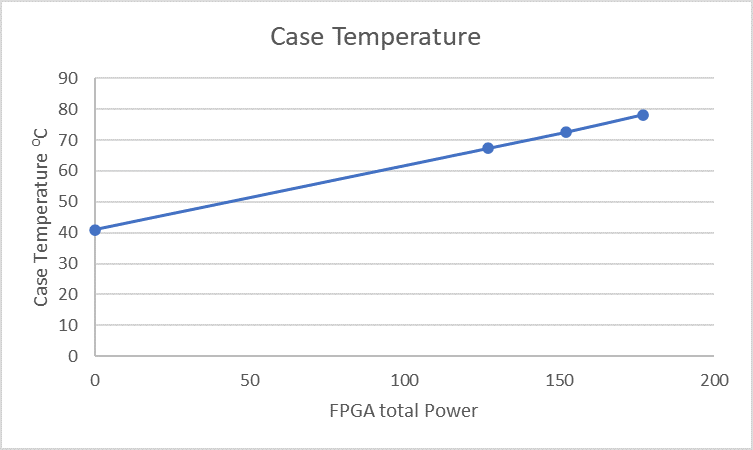
The above graph shows that the effective ΨCA is 0.2°C/W and the effective ambient temperature is 41°C. Referring to the following figure, we can see that by entering these values into the PTC, we find that the maximum junction temperature for this case is 84°C. These results indicate that, depending on the maximum required TJ, there may still be some margin.
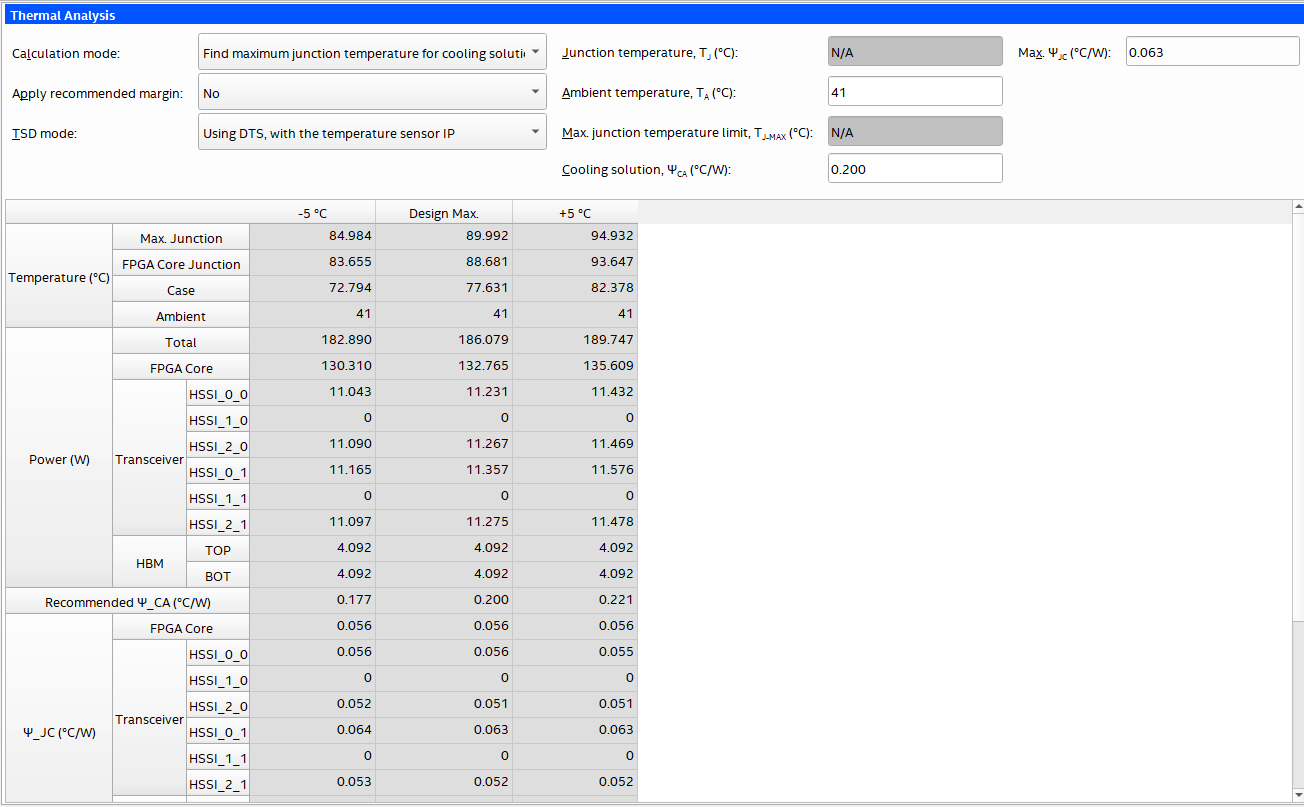
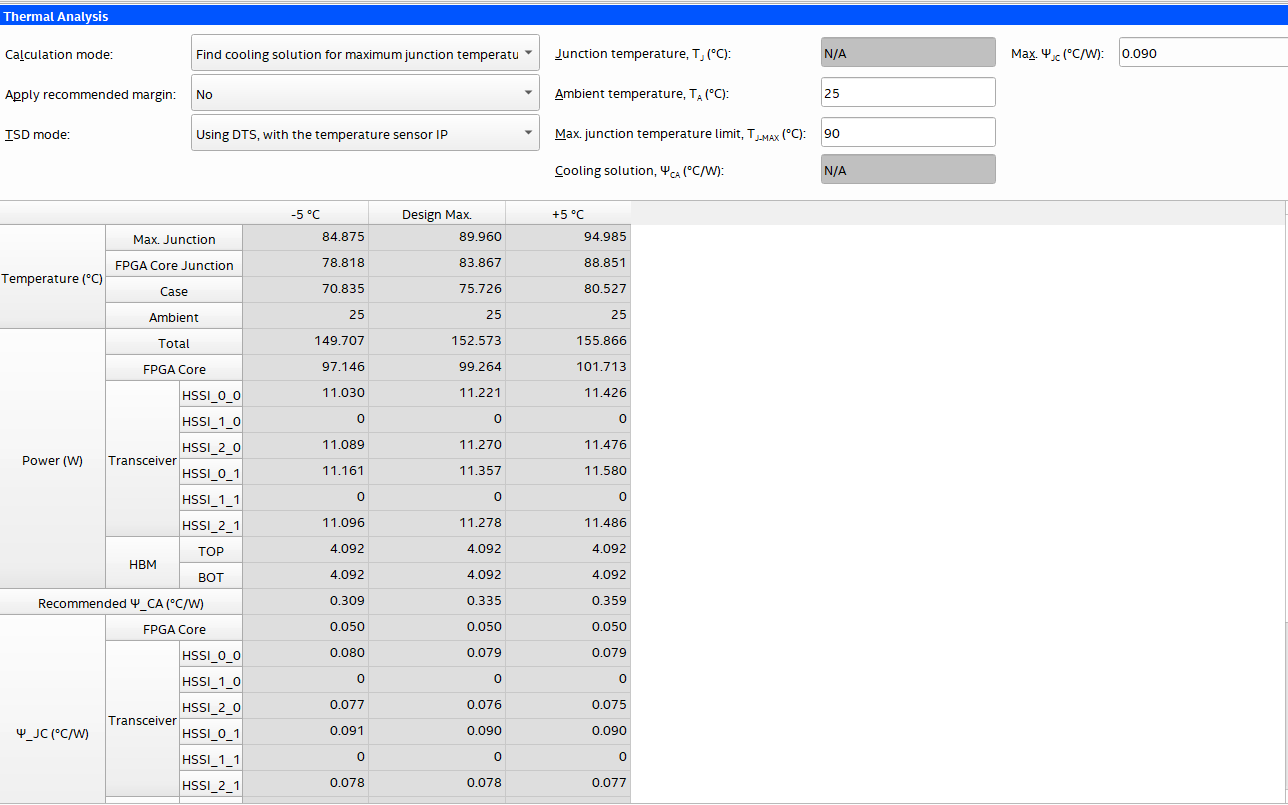
If we assume that the maximum allowable TJ is 90°C, then by adding functionality to the core we can determine at what core power level the maximum TJ reaches 90°C. The figure below shows the results on the PTC Thermal page, where the total FPGA power is found to be 186 watts.
Another way to approach this, would be to enter your design with the effective ambient temperature of 41°C and the desired maximum TJ where the viable solutions would be those with ΨCA ≤ 0.2°C/W.