A newer version of this document is available. Customers should click here to go to the newest version.
Examine Bottlenecks on GPU Roofline Chart
GPU Roofline Insights perspective enables you to view your application performance in relation to the maximum capabilities of your hardware plotted on a Roofline chart, which is available in the GPU Roofline Regions view.
Explore Performance-Limiting Factors
Intel® Advisor visualizes the maximum compute capacity and maximum memory bandwidth of your hardware on a Roofline chart:
- Horizontal lines indicate compute capacity limitations preventing kernels from achieving better performance without some form of optimization.
- Diagonal lines indicate memory bandwidth limitations preventing kernels from achieving better performance without some form of optimization:
- L3 cache roof: Represents the maximal bandwidth of the L3 cache for your current graphics hardware. Measured using an optimized sequence of load operations, iterating over an array that fits entirely into L3 cache.
- SLM cache roof: Shared local memory (SLM). Represents the maximal bandwidth of the SLM for your current graphics hardware. Measured using an optimized sequence of load and store operations that work only with SLM.
- GTI roof: Graphics technology interface (GTI). Represents the maximum bandwidth between the GPU and the rest of the system on a chip (SoC). This estimate is calculated via analytical formula based on the maximum frequency of your current graphics hardware.
- DRAM roof: Dynamic random-access memory (DRAM). Represents the maximal bandwidth of the DRAM memory available to your current graphics hardware. Measured using an optimized sequence of load operations, iterating over an array that does not fit in GPU caches.
- HBM roof: High bandwidth memory (HBM). Represents the maximum bandwidth of HBM memory available to your current graphics hardware. Measured using an optimized sequence of load operations iterating over an array that does not fit in discrete GPU caches.
Identify Hotspots and Estimate Room for Optimization
According to Amdahl’s law, optimizing kernels that take the largest portion of the total program time leads to greater speedups than optimizing kernels that take the smaller portion of the total time. Intel Advisor enables you to identify kernels taking the largest portion of the total time as hotspots. To find the best candidates for optimization, notice the dots on the Roofline chart. The dots on the chart correspond to kernels running on GPU. Size and color of the dots depends on a dot, or point weight, which is the percentage of the dot time to the program total time and is calculated as dot self-elapsed time / program total elapsed time * 100. By default, the size and color of dots is the following:
- Small green dots represent kernels with relatively small execution time (0-1% of the total time).
- Medium-sized yellow dots represent kernels with medium-range execution time (1-20% of the total time).
- Large red dots represent kernels with the largest execution time (20-100% of the total time).
 button on the Roofline chart to open the Loop Weight Representation menu.
The best candidates for optimization are the largest dots (red ones by default) located far below the topmost rooflines because:
- Their size clearly shows that improving self elapsed time for these kernels has a significant impact on the total time of the program.
- Their location shows that there is a significant headroom for optimization.
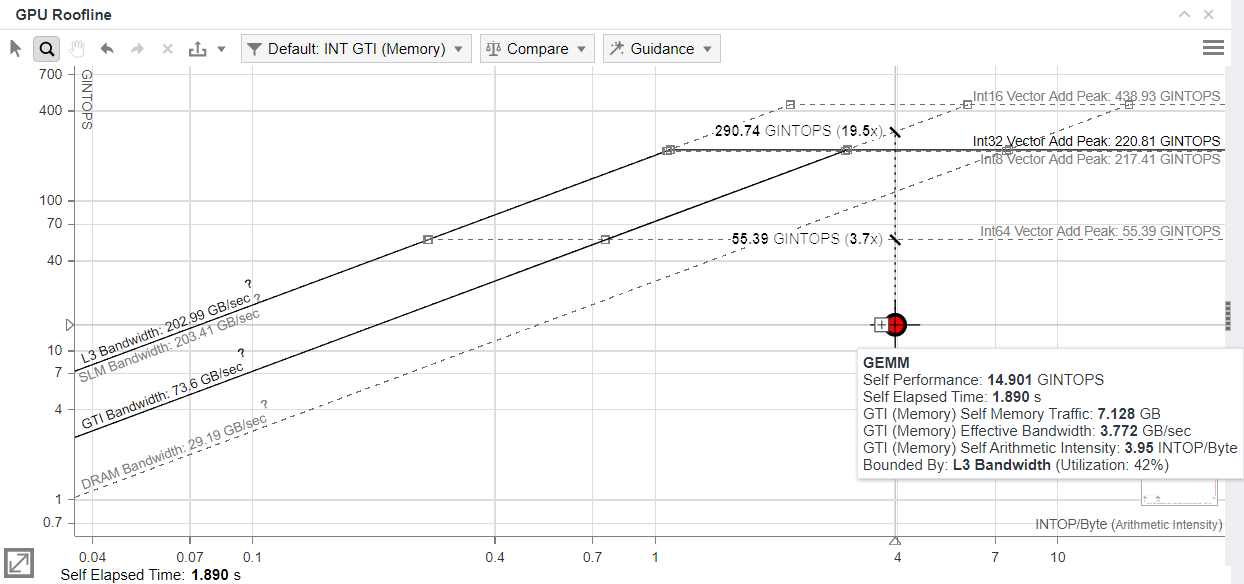
To identify optimization headroom for a specific kernel, double-click a dot on the chart to highlight the roof that limits its performance. The roofs above the dot represent the restrictions preventing it from achieving a higher performance. The dot cannot exceed the topmost rooflines, as they represent the maximum capabilities of the hardware. The farther the dot is from the topmost roofs, the more room for improvement there is.
Hover over the selected dot to view its projection on the limiting roof and the estimated speedup that can be achieved by optimizing this kernel.
Similar approach is used for multi-tile GPUs, with the Roofline chart depicting each GPU tile. For example, in case of a multi-tile GPU with two tiles, there are two dots in the Roofline chart (one dot per tile). If the tiles perform equally, the dots can be in the same place on the chart, or very close to each other. If there is a distance between the dots, consider the following:
- A dot on the left indicates that this tile is experiencing memory bandwidth limitations.
- A dot on the right indicates that this tile is experiencing compute capacity limitations.
To view the details on each tile, expand the hotspot. You can, for example, switch to the Source and Assembly view and examine the detailed information for the GPU tile and GPU device.
Using this analysis, you may want to correct the unbalanced operation and have all GPU tiles in the central zone, indicating they are performing in a more efficient way.
Explore Kernel Performance at Different Memory Levels
By default, Intel Advisor collects data for all memory levels. This enables you to examine each kernel at different cache levels and arithmetic intensities and provides precise insights into which cache level causes the performance bottlenecks.
Configure Memory-Level Roofline Chart
- Expand the filter pane in the GPU Roofline chart toolbar.
- In the Memory Level section, select the memory levels you want to see metrics for.
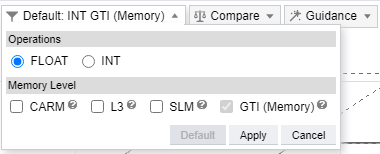 NOTE:By default, GPU Roofline reports data for GTI memory level (for integrated graphics) and HBM/DRAM memory level (for discrete graphics).
 - Click Apply.
Interpret Memory-Level GPU Roofline Data
Double-click a dot on the chart to review and compare the changes in traffic between the memory levels displayed, identify a memory hierarchy bottleneck, and highlight the roof that limits your kernel performance the most. You can use this information to determine optimization steps. Labeled dots and/or X marks are displayed, representing memory levels with arithmetic intensity for the selected kernel at the following memory levels:
- CARM: Memory traffic generated by all execution units (EUs). Includes traffic between EUs and corresponding GPU cache or direct traffic to main memory. For each retired instruction with memory arguments, the size of each memory operand in bytes is added to this metric.
- L3: Data transferred directly between execution units and L3 cache.
- SLM: Memory access to/from Shared Local Memory (SLM), a dedicated structure within the L3 cache.
- HBM: the maximum bandwidth of HBM memory available to your current graphics hardware. The HBM roof is measured using an optimized sequence of load operations iterating over an array that does not fit in discrete GPU caches.
- GTI: GPU memory read bandwidth, which is the accesses between the GPU, chip uncore (LLC), and main memory on integrated GPUs. Use this to understand external memory traffic.
- DRAM: Maximum DRAM memory bandwidth available to your current GPU. The DRAM roof is measured using an optimized sequence of load operations iterating over an array that does not fit in GPU caches. This roof represents the maximum bandwidth between the GPU, chip uncore (LLC), and main memory on discrete GPUs.
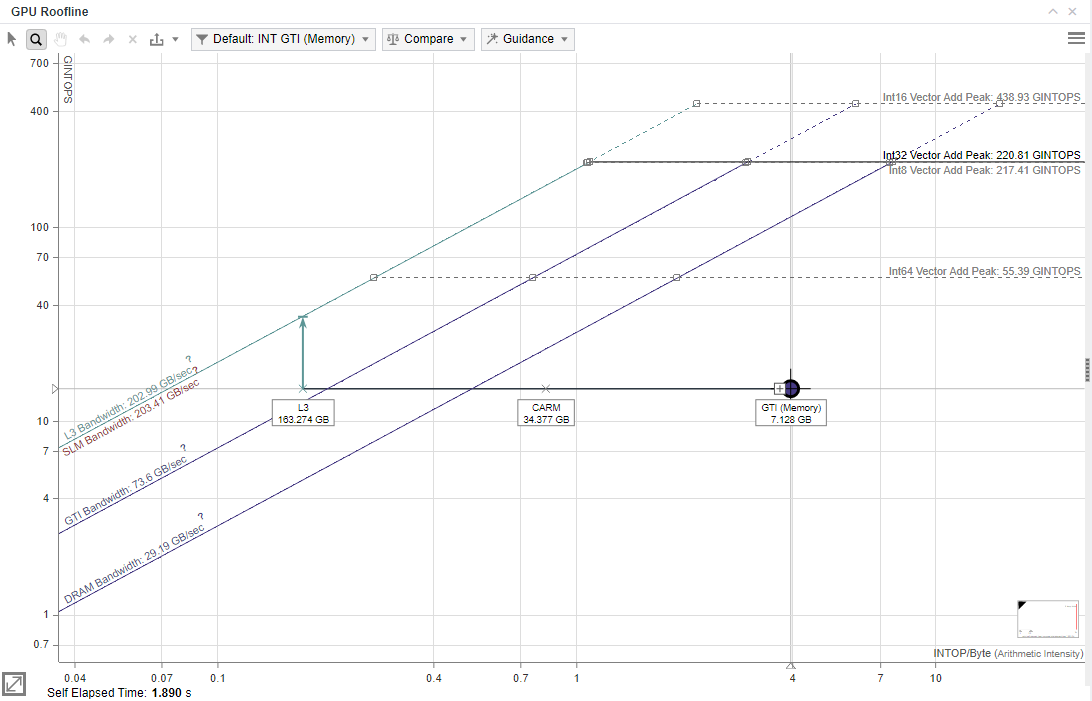
The vertical distance between memory dots and their respective roofline shows how much you are limited by a given memory subsystem. If a dot is close to its roof line, it means that the kernel is limited by the bandwidth of this memory level.
The horizontal distance between memory dots indicates how efficiently the kernel uses cache. For example, if L3 and GTI dots are very close on the horizontal axis for a single kernel, the kernel uses L3 and GTI similarly. This means that it does not use L3 and GTI efficiently. Improve re-usage of data in the code to improve application performance.
Arithmetic intensity on the x axis determines the order in which dots are plotted, which can provide some insight into your code's performance. For example, the CARM dot is typically far to the right of the L3 dot, as read/write access by cache lines and CARM traffic is the sum of actual bytes used in operations. To identify room for optimization, check L3 cache line utilization metric for a given kernel. If the L3 cache line is not utilized well enough, check memory access patterns in your kernel to improve its elapsed time.
Ideally, the CARM and the L3 dots should be located close to each other, and the GTI dot should be far to the right from them. In this case, the kernel has good memory access patterns and mostly utilizes the L3 cache. If the kernel utilizes the L3 cache line well, it:
- Spends less time on transferring data between L3 and CARM memory levels
- Uses as much data as possible for actual calculations
- Enhances the elapsed time of the kernel and of the entire application
Determine If Your Kernel Is Compute or Memory Bound
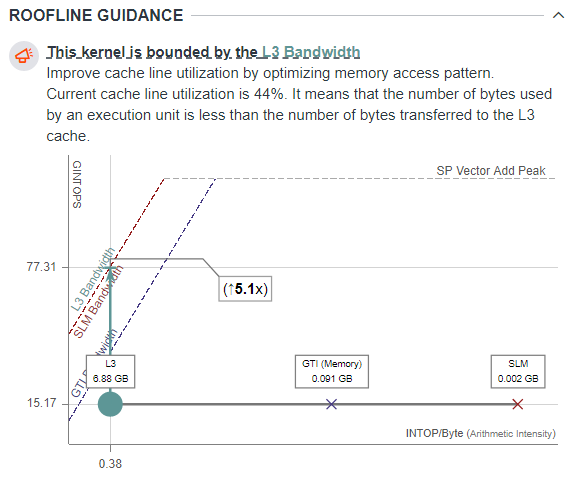
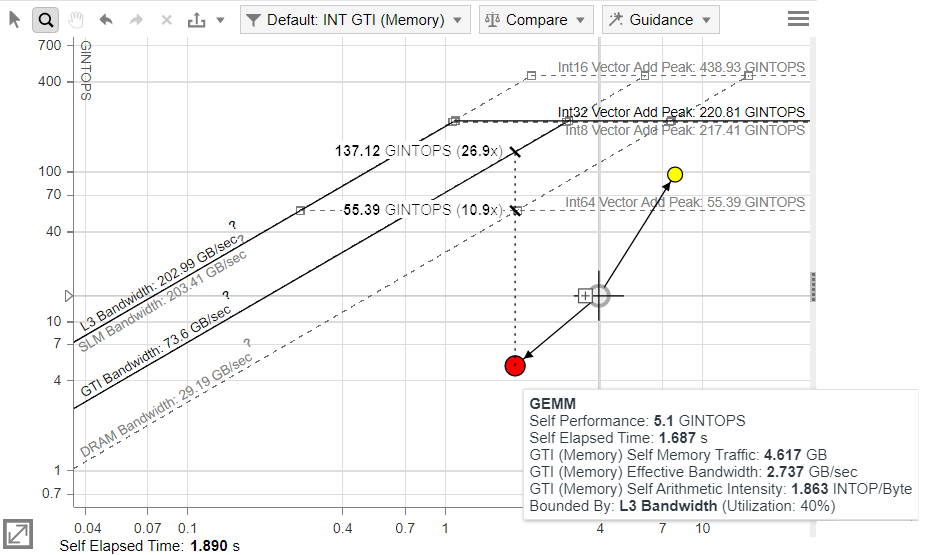
To determine if your selected kernel is compute or memory bound, examine the Roofline chart for the selected kernel with the following data in the Roofline Guidance section in the GPU Details tab:
- Guidance on possible optimization steps depending on the factor limiting performance. Click the bounding factor to expand the hint.
- Amount of data transferred for each cache memory level.
- The exact roof that limits the kernel performance. The arrow points to what you should optimize the kernel for and shows the potential speedup after the optimization in the callout.
If the arrow points to a diagonal line, the kernel is mostly memory bound. If the arrow points to a horizontal line, the kernel is mostly compute bound. Intel® Advisor displays a compute roof limiting the performance of your kernel based on the instruction mix used.
The chart is plotted for a dominant type of operations in a code (FLOAT or INT) and shows only roofs with cache memory levels, data types, and instructions mix used in the kernel. If there is no FLOP or INTOP in the kernel, the single-kernel Roofline chart is not shown.
For example, in the screenshot below, the kernel is memory bound. Its performance is limited by the L3 Bandwidth because the kernel uses this memory level to transfer the largest amount of data (6.88 GB) compared to other memory levels. If you optimize the memory access patterns in the kernel, it gets up to 5.1x speedup.
Investigate Performance of Compute Tasks
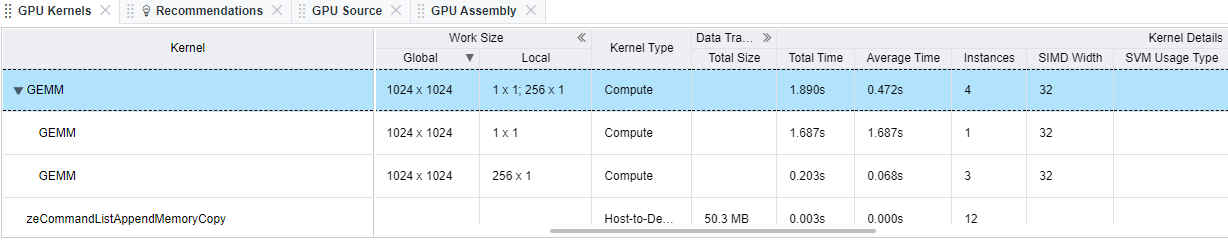
Initialization of the same kernel with different global and local work size is called a compute task. For kernels initialized with different global and local work size, you can review and compare the performance of its compute tasks.
- In the GPU Roofline chart:
- Click a dot on a Roofline chart and click the + button that appears next to the dot. The dot expands into several dots representing the corresponding compute tasks.
- Click a dot representing a compute task and view details about its global and local work size in the GPU Details pane.
- Hover over a dot representing a compute task to review and compare its performance metrics. Double-click the dot to highlight a roofline limiting the performance of a given instance.
- In the GPU pane grid, you can drill down to the detailed information for each GPU kernel, examine the source, and decide how to optimize the workload:
- Expand a kernel in the Kernels column.
- View the information about the work size of a compute task by expanding the Work Size column in the grid. To view the number of compute tasks with a given global/local size, expand the Kernel Details column in the grid and examine the Instances metric.
- Compare performance metrics for different compute tasks using the grid and the GPU Details pane.
You can also examine information about the GPU adapter and GPU stack (tile). For a multi-tile & multi-GPU system, Intel® Advisor shows this performance data with one table row per each GPU tile. To view performance data for each GPU tile, examine the GPU Adapter and GPU Stack columns for the corresponding GPU. For example, if a task was running on two tiles, locate the row with the target GPU kernel, expand it, and examine the two rows of data that correspond to these tiles.
The dependent views also display data for multiple tiles: GPU Roofline chart, GPU Source, GPU Assembly, GPU Details with Instruction Mix.
Selecting a dot on a chart automatically highlights the respective kernel in the grid, and vice versa.
 button on the top pane. For details about CPU Roofline data, see CPU / Memory Roofline Insights Perspective
Next Steps
Explore detailed information about each kernel and get actionable recommendations for optimization of the kernel code using the GPU Details tab of the GPU Roofline Insights report.