Discover Where Vectorization Pays Off The Most
With the Vectorization and Code Insights perspective, you can identify loops and unctions in your application that can benefit most from vector parallelism, locate un-vectorized and under-vectorized time-consuming functions/loops and calculate estimated performance gain achieved by vectorization.
This page explains how to profile the vec_samples application and identify vectorization hotspots to improve performance of your code. You can also use your own application to follow the instructions below.

Follow the steps:
- Unpack and build your application.
- Establish performance baseline.
- Disambiguate pointers.
- Generate instructions for the highest instruction set architecture.
- Next steps
Prerequisites
- Install the Intel Advisor as a standalone or as part of Intel® oneAPI Base Toolkit. For installation instructions, see Install Intel Advisor in the user guide.
- Make sure you install the Intel® oneAPI DPC++/C++ Compiler: if you have installed Intel® oneAPI Base Toolkit, the compiler is already installed as part of it. Otherwise, you need to install the compiler as standalone solution. For installation instructions, see Intel® oneAPI Toolkits Installation Guide.
- Set up environment variables for the Intel Advisor and Intel® C++ Compiler Classic. For example, run the setvars script in the installation directory. For detailed instructions, see Get Started with the Intel® oneAPI DPC++/C++ Compiler.
This document assumes you installed the tools to a default location. If you installed the tools to a different location, make sure to replace the default path in the commands below.
IMPORTANT:Do not close the terminal or command prompt after setting the environment variables. Otherwise, the environment resets.
Unpack and Build Your Application
On Linux* OS
From the terminal where you set the environment variables:
- Go to /opt/intel/oneapi/advisor/latest/samples/en/C++ directory.
- Copy the vec_samples.tgz file to a writable directory or share on your system.
- Extract the sample from the .tgz archive.
- Change directory to the vec_samples/ directory in its unzipped location.
- Build the sample application in release mode:
make baselineThe command build the application with the -O2 -g compiler options. For details about building your own applications, see Build Target Application.
- Run the application to verify the build:
make baselineYou should see an output similar to the following indicating that you successfully built the application:
ROW:47 COL: 47
Execution time is 6.020 seconds
GigaFlops = 0.733887
Sum of result = 254364.540283
On Windows* OS
From the command prompt where you set the environment variables:
- Go to C:\Program Files (x86)\Intel\oneAPI\advisor\latest\samples\en\C++ directory.
- Copy the vec_samples.zip file to a writable directory or share on your system.
- Extract the sample from the .zip archive.
- Change directory to the vec_samples\ directory in its unzipped location.
- Build the sample application in release mode as follows:
build.bat baselineThe script builds the application with the /O2 /Qstd=c99 /fp:fast /Isrc /Zi /Qopenmp compiler options. For details about building your own applications, see Build Target Application.
- Run the sample application to verify the build:
vec_samples.exeYou should see an output similar to the following indicating that you successfully built the application:
ROW:47 COL: 47
Execution time is 6.020 seconds
GigaFlops = 0.733887
Sum of result = 254364.540283
Establish Performance Baseline
Run Vectorization and Code Insights from Graphical User Interface (GUI)
- From the terminal or command prompt where you set the environment variables, launch the Intel Advisor GUI:
advisor-gui - Create a project for the just-built vec_samples application. For details, see Before You Begin.
When in the Project Properties dialog box, make sure the Inherit settings from Survey Hotspots Analysis Type checkbox is selected in the Trip Counts and FLOP Analysis, Dependencies Analysis, and Memory Access Patterns Analysis types.
- In the Perspective Selector window, choose the Vectorization and Code Insights perspective.
- In the Analysis Workflow pane, set data collection accuracy level to Low, and click the
 button to run the perspective.
 At this accuracy level, Intel Advisor runs Survey analysis and collects performance metrics of your application to locate under- and non-vectorized hotspots.
Run Vectorization and Code Insights from Command Line Interface (CLI)
On Linux OS
From the command prompt where you set the environment variables:
- Collect Survey data using the following command:
advisor --collect=survey --project-dir=./results -- ./vec_samples - Generate a Survey report using the following command:
advisor --report=survey --project-dir=./resultsThe report summary will be printed to the terminal or command prompt. A copy of this report is saved into ./vec_samples/e000/hs000/advisor-survey.txt.
When the analysis execution completes, the vec_samples project is created automatically, which includes the Vectorization and Code Insights results. You can view them from Intel Advisor GUI.
On Windows OS
From the command prompt where you set the environment variables:
- Collect Survey data using the following command:
advisor --collect=survey --project-dir=./results -- vec_samples.exe - Generate a Survey report using the following command:
advisor --report=survey --project-dir=./results
The report will be printed to the terminal or command prompt. A copy of this report is saved into ./vec_samples/e000/hs000/advisor-survey.txt.
When the analysis execution completes, the vec_samples project is created automatically, which includes the Vectorization and Code Insights results. You can view them from Intel Advisor GUI.
Examine Results
If you collect data using GUI, Intel Advisor automatically opens the results when the collection completes.
If you collect data using CLI, open the results in GUI using the following command:
advisor-gui ./resultsIf the result does not open automatically, click Show Result.
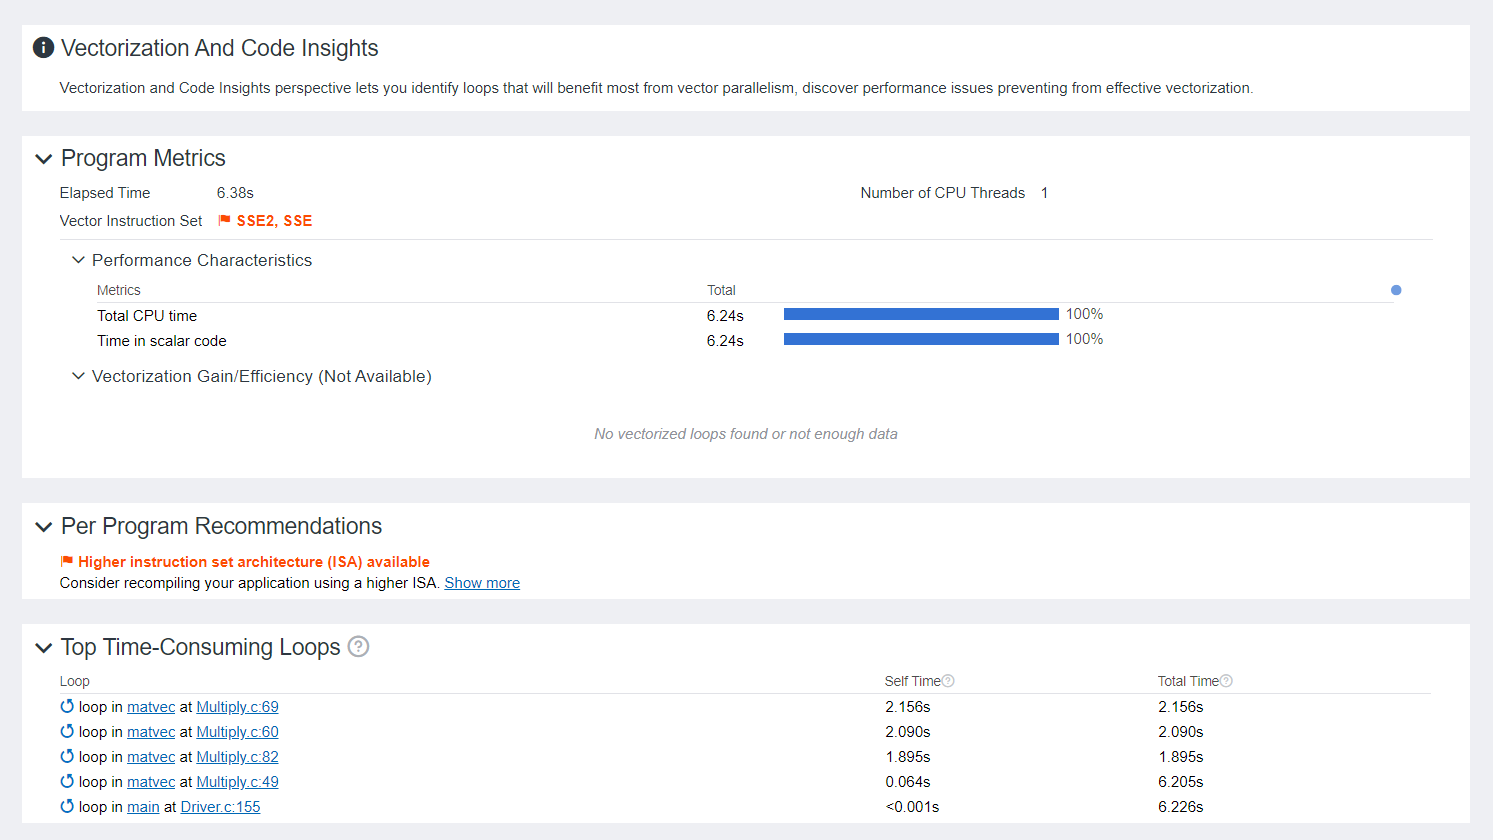
When you open the Vectorization and Code Insights result in GUI, Intel Advisor shows the Summary tab first. This window is a dashboard containing the main information about application execution, performance hints, and indication of vectorization problems in your application.

In the Summary window, notice the following:
- Assess your application performance using the Elapsed Time metric in the Program Metrics pane. Each improvement you make to under- and unvectorized functions/loops contributes to improvement of this metric. Consider revising program elapsed time after every iteration of running the perspective.
- In the Program Metrics pane, Time in scalar code is 100% and the Vectorization Gain/Efficiency is empty. It means there are no vectorized loops in the application.
- In the Program Metrics pane, Vector Instruction Set is SSE2 and SSE. This metric is highlighted in red. Hover over the metric value to see a warning that a higher instruction set architecture available. This warning is also reported in the Per Program Recommendations pane. Consider generating instructions for it and recompiling your application to improve performance.
- View the top hotspots for optimization in the Top Time-Consuming Loops pane. Click the largest hotspot to view detailed metrics for it in the Survey Report.
Switch to the Survey & Roofline tab, you can analyze performance for each loop/function in the application.

- The Elapsed time value in the top left corner. This is the baseline against which subsequent improvements will be measured.
- In the Type column, all detected loops are scalar.
- In the Why No Vectorization? column, the compiler detected or assumed a vector dependence in most loops.
- For one of the loops where the compiler detected or assumed a vector dependence, click the
 control to display how-can-I-fix-this-issue? information in the Why No Vectorization? pane.
 - Review the Summary window, which appears after the perspective executes. This window is a dashboard containing the main information about application execution, performance hints, and indication of vectorization problems in your application.
Create a Read-only Snapshot for the Baseline Result
Create a read-only result snapshot, which you can share or compare with other results. To do that:
- Click the
 icon.
icon. - Type snapshot_baseline in the Result name field.
- Select the Pack into archive checkbox to enable the Result path field.
- Browse to a desired location, then click the OK button to save a read-only snapshot of the current result.
- If the Survey Report remains grayed out after the snapshot process is complete, click anywhere on the report.
To review performance improvements, open the saved result snapshots and compare the metrics with those in the snapshot_baseline snapshot.
Disambiguate Pointers
Two pointers are aliased if both point to the same memory location. Storing to memory using a pointer that might be aliased may prevent some optimizations. For example, it may create a dependency between loop iterations that would make vectorization unsafe. Sometimes the compiler can generate both a vectorized and a non-vectorized version of a loop and test for aliasing at runtime to select the appropriate code path. If you know pointers do not alias, and inform the compiler, it can avoid the runtime check and generate a single vectorized code path.
In Multiply.c, the compiler generates runtime checks to determine if point b in function matvec(FTYPE a[][COLWIDTH], FTYPE b[], FTYPE x[]) is aliased to either a or x. If Multiply.c is compiled with the NOALIAS macro, the restrict qualifier of argument b informs the compiler the pointer does not alias with any other pointer and array b does not overlap with a or x.
To see if the NOALIAS macro improves performance, do the following:
On Linux OS
From the same terminal window:
- Navigate to the vec_samples/ directory.
- Rebuild the target application with the NOALIAS macro:
make noaliasThe command builds the application with the following compiler options: -O2 -g -D NOALIAS.
- Rerun the Vectorization and Code Insights perspective from GUI or CLI with the same configuration as for the baseline result. See the sections above for instructions.
On Windows OS
From the same terminal window:
- Navigate to the vec_samples directory.
- Rebuild the target application with the NOALIAS macro:
build.bat noaliasThe script builds the application with the following compiler options: /O2 /Qstd=c99 /fp:fast /Isrc /Zi /Qopenmp /DNOALIAS.
- Rerun the Vectorization and Code Insights perspective from GUI or CLI with the same configuration as for the baseline result. See the sections above for instructions.
View the Results
If you collect data using GUI, Intel Advisor automatically opens the results when the collection completes.
If you collect data using CLI, open the results in GUI using the following command:
advisor-gui ./vec_samplesIf the result does not open automatically, click Show Result.
Check changes in the Summary window:
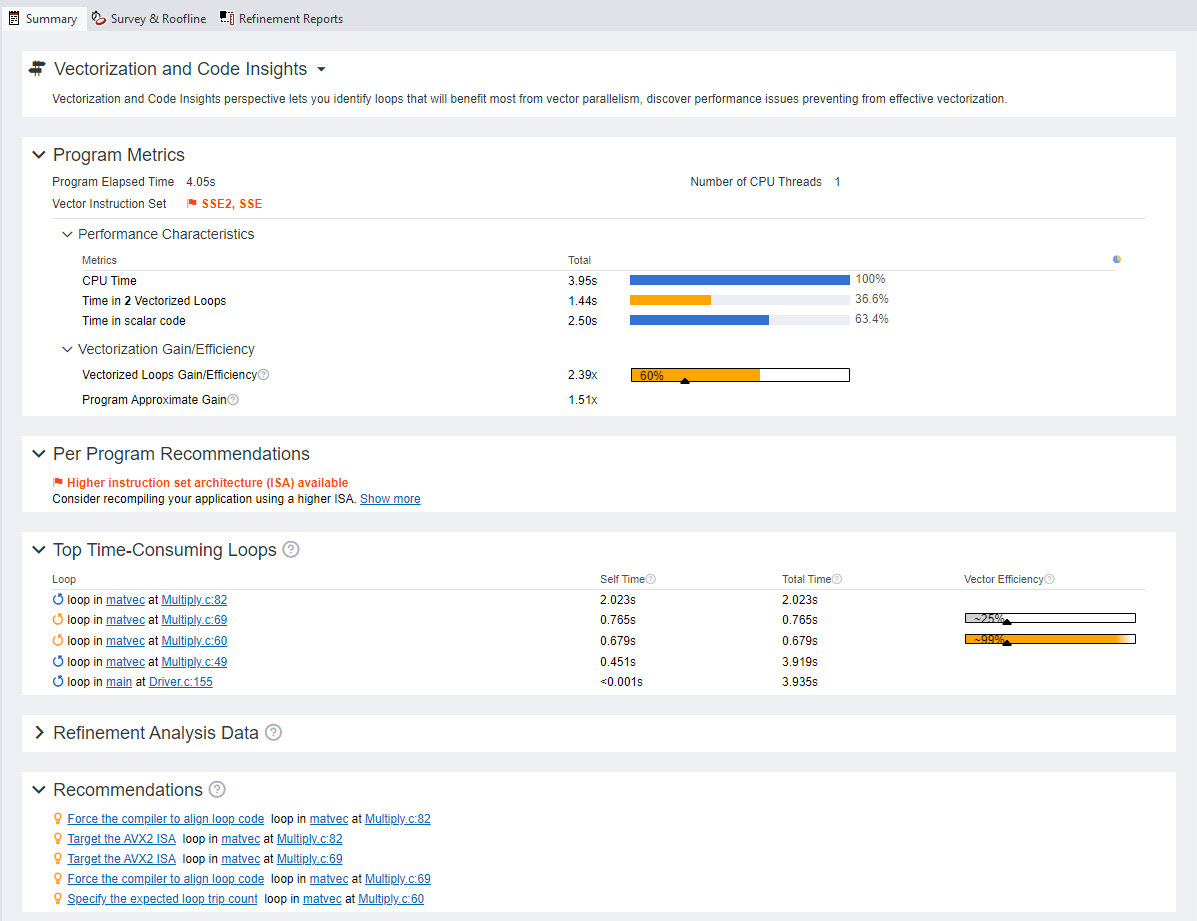
- In the Program Metrics pane, a new metric Time in 2 Vectorized Loops appeared meaning that the compiler vectorized two loops. The time in the vectorized loops is 36.6% of the application execution time.
- Examine the Vectorization Gain/Efficiency section of the pane. The loops are vectorized with 60% efficiency and have 2.39x speedup compared to their scalar version, but there is still room for more improvement. The whole application has 1.51x speedup compared to the fully scalar version.
- The Elapsed time improves substantially.

Open the Survey & Roofline tab to assess the changes in application performance. In the report, notice the following:
- The compiler successfully vectorizes two loops: in matvec at Multiply.c:69 and in matvec at Multiply.c:60.
The loop in matvec at Multiply.c:60 has a high efficiency (99%) and 3.96x estimated gain. The matvec at Multiply.c:69 efficiency is lower (25%) and the bar is gray, which means that the achieved vectorization efficiency is lower than the original scalar loop efficiency. Hover over a bar in the Efficiency column to see the explanation for the estimated efficiency.
- Click the
 icon next to the two vectorized loops. Notice both loops have a remainder loop present. Click the
  icon in the Trips Counts column set to expand it. The remainder loops are present because the trip count values for the remainder loops are not a multiple of the VL (Vector Length) value.
Create a Read-only snapshot
Click the  icon and save a snapshot_noalias result.
Generate Instructions for the Highest Instruction Set Architecture
Generating code for different instruction sets available on your compilation host processor may improve performance.
The QxHost (Windows OS) and xHost (Linux OS) options tell the compiler to generate instructions for the highest instruction set available on the compilation host processor.
To see if the QxHost and xHost options improve performance, do the following:
On Linux OS
From the same terminal window, build the application:
- Navigate to the vec_samples/ directory.
- Rebuild the target application as follows:
make xhostThe command builds the application with the following compiler options: -g -D NOALIAS -xHost.
On Windows OS
From the same command prompt window:
- Navigate to the vec_samples/ directory.
- Rebuild the target application as follows:
build.bat xhostThe script builds the application with the following compiler options: /O2 /Qstd=c99 /fp:fast /Isrc /Zi /Qopenmp /DNOALIAS /QxHost.
Re-run the Vectorization and Code Insights perspective from GUI or CLI.
Run Vectorization and Code Insights from GUI
- Open the project in GUI:
advisor-gui .\vec_samples - In the Analysis Workflow pane for the Vectorization and Code Insights perspective, set data collection accuracy level to Medium.
At this accuracy level, Intel Advisor collects Survey and Characterization (Trip Counts) data.
- Run the perspective.
Run Vectorization and Code Insights from CLI
On Linux OS
From the same terminal window:
- Collect Survey data using the following command:
advisor --collect=survey --project-dir=./results -- ./vec_samples - Collect Trip Counts data using the following command:
advisor --collect=tripcounts --project-dir=./results -- ./vec_samples
When the analysis execution completes, the vec_samples project is created automatically, which includes the Vectorization and Code Insights results. You can view them from Intel Advisor GUI.
On Windows OS
From the same command prompt window:
- Collect Survey data using the following command:
advisor --collect=survey --project-dir=./results -- vec_samples.exe - Collect Trip Counts data using the following command:
advisor --collect=tripcounts --project-dir=./results -- vec_samples.exe
When the analysis execution completes, the vec_samples project is created automatically, which includes the Vectorization and Code Insights results. You can view them from Intel Advisor GUI.
View the Results
If you collect data using GUI, Intel Advisor automatically opens the results when the collection completes.
If you collect data using CLI, open the results in GUI using the following command:
advisor-gui ./resultsIf the result does not open automatically, click Show Result.
Check the changes in the Summary and open the Survey Report to assess the changes in application performance. In the report, notice the following:
The Elapsed time probably improves.
The values in the Vector ISA and VL columns in the top pane (probably) change.
Create a Read-only Snapshot
Click the  icon and save a snapshot_xhost result.
Next Steps
- Pay attention to data dependencies assumed by the compiler and check, whether these dependencies are real and prevent your functions/loops from vectorizing. To do that, run the Dependencies analysis, mark the loops containing proven dependencies, and rebuild the application adding /DREDUCTION (Windows OS) and -D REDUCTION (Linux OS) compiler options.
- Eliminate issues leading to significant vector code execution slowdown or block automatic vectorization by the compiler. To do that, run the Memory Access Patterns and modify memory access patterns in the problematic functions/loops.
- Align data to assist automatic vectorization. For details, see Data Alignment to Assist Vectorization.
- Reorganize code to inline loops and enable the compiler to tell which variables you want to process and determine that vectorization is safe.