XPU Offload View
Use the XPU Offload viewpoint to assess and optimize the performance of AI or ML workloads on Intel Neural Processing Units (NPUs) and Graphical Processing Units(GPUs).
When the XPU Offload analysis executes, Intel® VTune™ Profiler collects NOC metric set data about the DDR bandwidth between the NPU and DDR memory. Once data collection completes, Intel® VTune™ Profiler prepares the results and displays them in the Summary window.
XPU Offload Default View
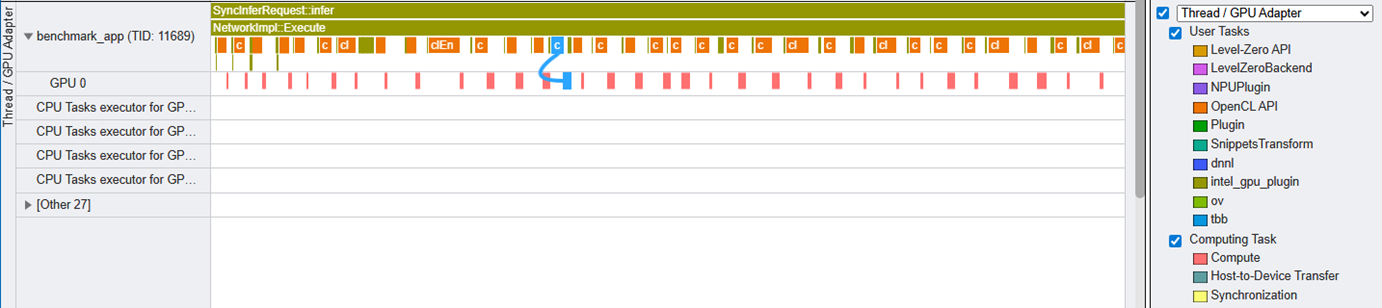
Default tab opening for the Offload viewpoint is the Timeline tab. With the default XPU Offload analysis type settings Intel VTune Profiler traces User Tasks (ITT API Tasks) and device-side tasks. When you click a GPU-side task, you can see its connection to a CPU-side task that submitted it. The legend on the right shows User Tasks domains that you can use in the ITT API domain allow list filter for the next collection runs.
A grid with default grouping by Computing Task contains basic data about GPU computing tasks collected during tracing.
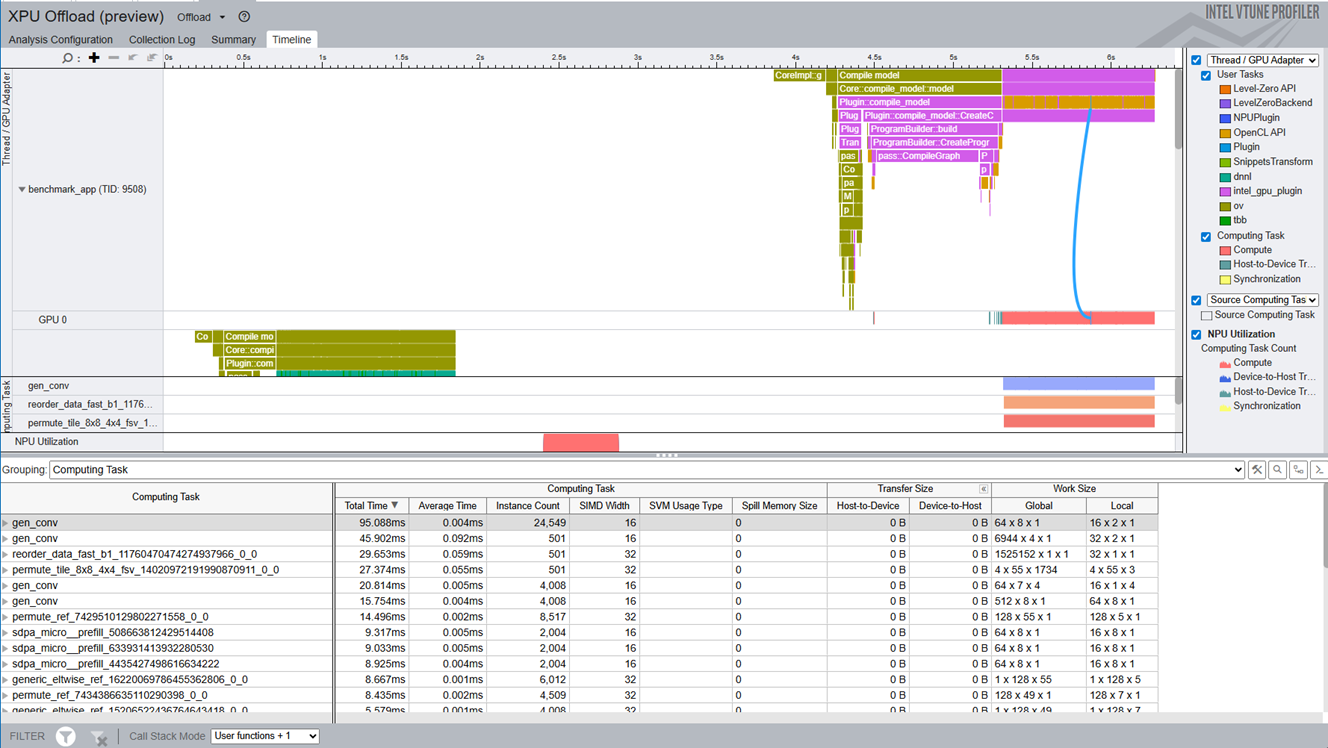
XPU Offload Timeline Window
The Timeline window displays all the CPU, GPU, and NPU activity data in one view. At the top, CPU threads appear sorted by CPU time so that the busiest threads are on top:

Next, the Thread / GPU Adapter area provides a unified, interactive timeline that visualizes the relationships between CPU and GPU kernel execution, making it easier to understand offload patterns and performance bottlenecks in heterogeneous workloads. The connection lines between related CPU and GPU tasks, helping you trace the flow of work across the system.
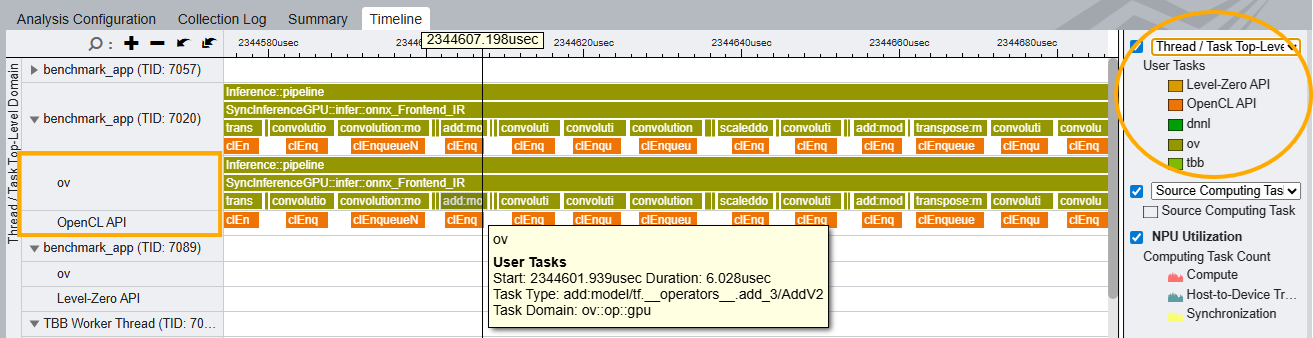
The Thread/Task Domain grouping allows you to see which threads are responsible for which types of API tasks (e.g., L0, OpenCL, oneDNN), making it easier to analyze mixed workloads.
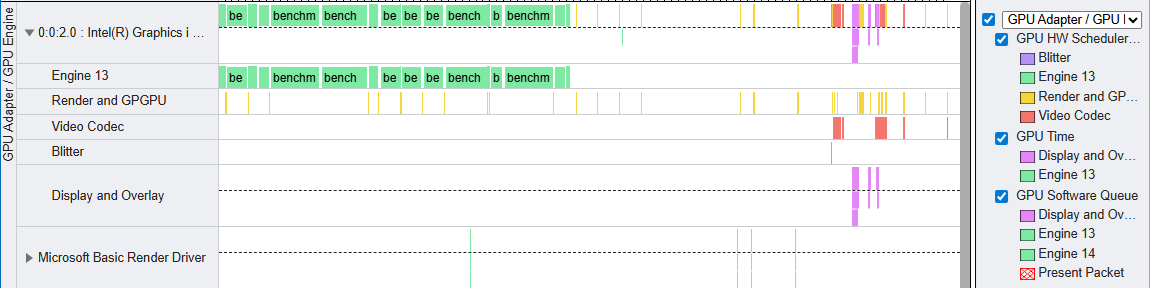
If you ran the analysis on Windows as Administrator, the section with GPU utilization by Adapters and Engines appears. This data contains GPU tasks that all the processes submitted system-wide to all the GPU Engines, providing the full picture.
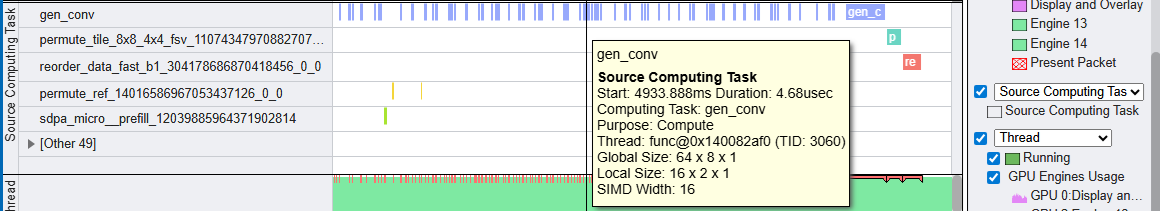
Within the Source Computing Task area, examine all the GPU computing tasks grouped by name with the heaviest at the top:
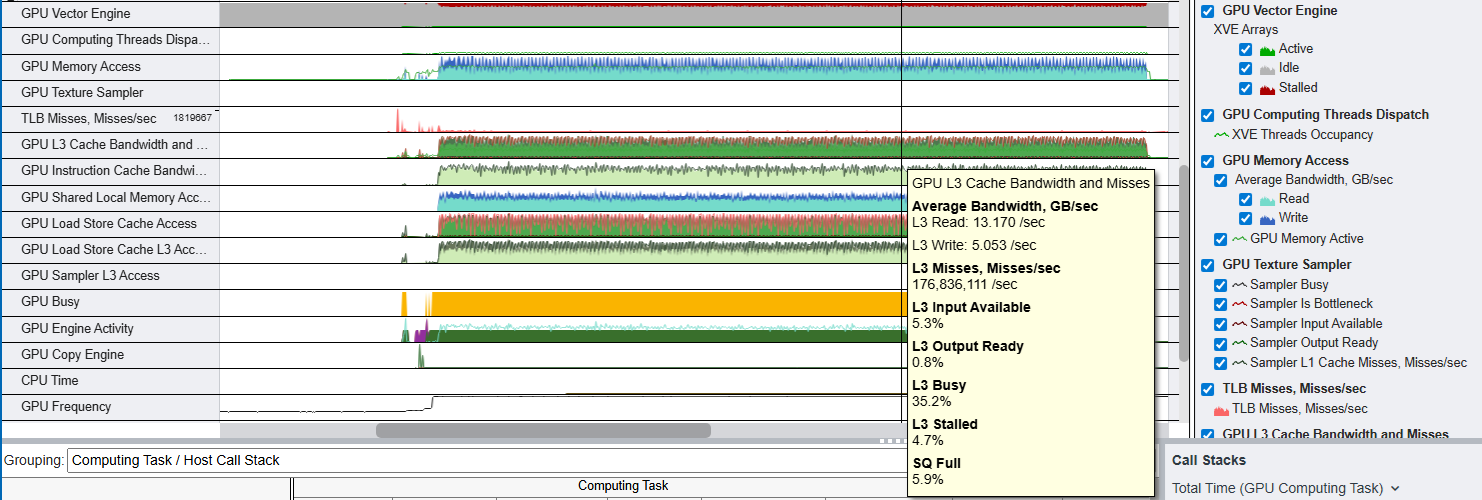
The area with GPU hardware metrics provides a view of major GPU performance data over time. The list of available metrics may vary depending on the GPU model.
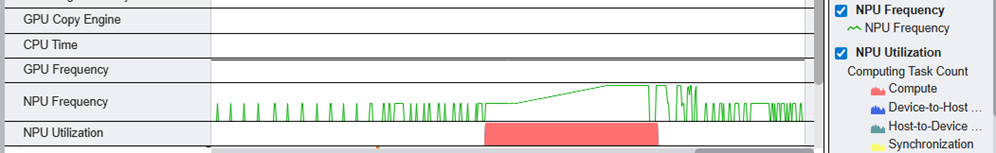
NPU metrics section displays NPU Utilization based on tracing data and depending on the selected metric set NPU DDR Bandwidth:

Or NPU Frequency:
XPU Offload Summary
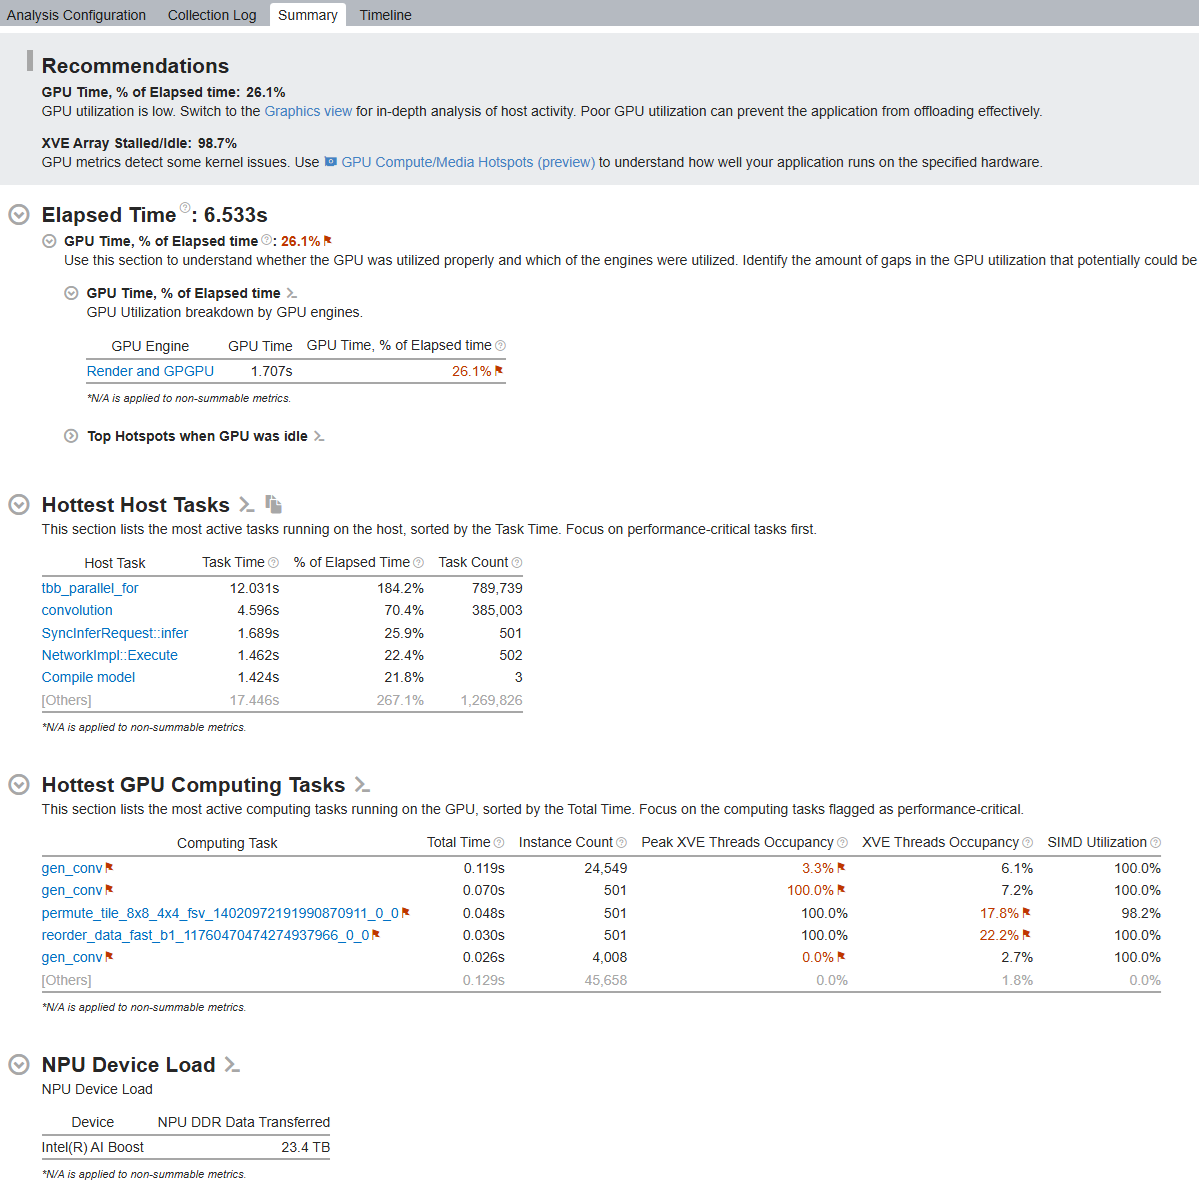
The Summary window displays NPU performance data, starting with these sections:
- GPU Time, % Elapsed Time - This section indicates the amount of time the GPU was busy with a breakdown by GPU Engines
- Hottest Host Talks - This section shows the top User Tasks (ITT API Tasks) sorted by Task Total Time.
- Hottest GPU Computing Tasks - This section shows the top GPU computing tasks sorted by Task Total Time.
- NPU Device Load - This section indicates the amount of data transferred between the NPU and DDR memory.
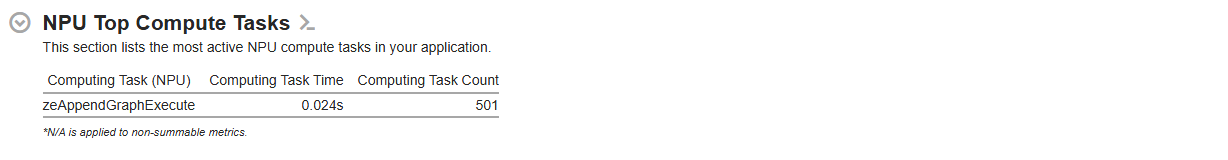
- NPU Top Compute Tasks - This section captures the total amount of time when tasks got executed on the NPU.
Next, see the list of Top Tasks to review the various host tasks which offloaded work onto the NPU.