XPU Offload Analysis (Preview)
Use the XPU Offload analysis to profile and optimize artificial intelligence (AI) workloads running on Intel architectures like Graphics Processing Units(GPUs) and Neural Processing Units(NPUs).
This is a PREVIEW FEATURE. A preview feature may or may not appear in a future production release. It is available for your use in the hopes that you will provide feedback on its usefulness and help determine its future. Data collected with a preview feature is not guaranteed to be backward compatible with future releases.
XPUs are the collection of Neural Processing Units (NPUs), Graphical Processing Units (GPUs) and CPU device cores. GPUs are a popular hardware choice for compute-intensive or graphics-intensive applications. An NPU can accelerate the performance of AI workloads that have been explicitly offloaded onto it by an operating system. NPUs are uniquely designed to improve the performance of AI and Machine Learning (ML) workloads.
Use the Intel® Distribution of OpenVINO™ toolkit to offload popular ML models (like speech or image recognition tasks) to Intel NPUs. Then use the XPU Offload analysis to profile AI and ML workloads. Collect performance data and optimize the performance of these AI/ML applications.
Default Settings for XPU Data Collection
XPU Offload analysis configuration provides granular per-category controls, allowing to precisely choose which data to collect and which to omit. The default settings are minimalistic: does not profile NPU, collects only the ITT-produced data on the CPU side, and enables tracing of the compute runtimes for GPU.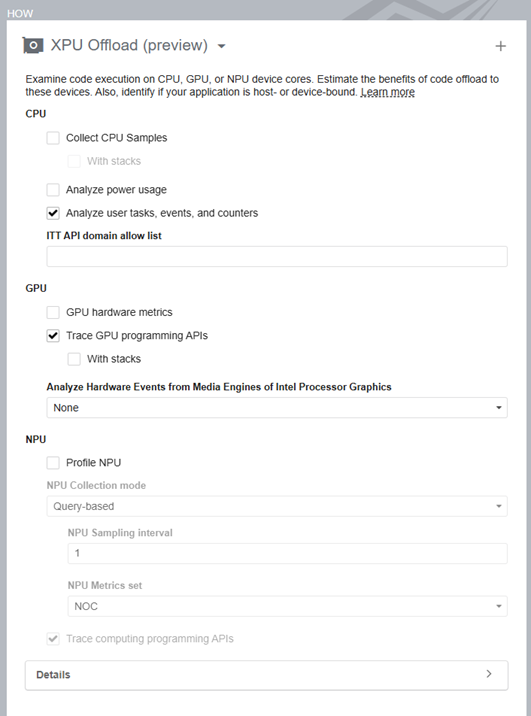
Configure and Run Analysis
In the VTune Profiler user interface, in the Accelerators group of the Analysis Tree, select XPU Offload(preview).
In the WHAT pane, specify the path to the AI/ML application in the Application bar.
If necessary, specify relevant Application parameters as well.
Set these collection options as needed:
CPU:
- Collect CPU Samples (with stacks) - Set this option to analyze CPU hotspots.
- Analyze power usage - Set this option to collect and analyze power and energy consumption metrics.
- Analyze user tasks, events, and counters - Set this option to collect the Instrumentation and Tracing Technology API (ITT API) tasks, events, and counters if your target uses the Task API to mark task regions.OpenVINO, oneDNN, and oneCCL are using the ITT mark-up. To reduce the amount of data collected you can use an ITT API domain allow list filter.
GPU:
- GPU Hardware metrics - Set this option to collect metrics based on the analysis of Processor Graphics events. Use these GPU performance metrics to estimate the efficiency of hardware usage and learn about next steps.
Target GPUs - On a multi-GPU system you can select for which GPUs the hardware metrics are going to be collected.
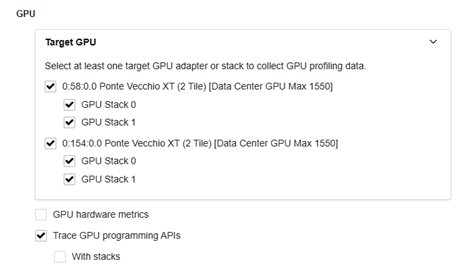
- Trace computing programming APIs - Set this option to analyze SYCL, Level-Zero, OpenCL™, and Intel® Video Processing Library (Intel® VPL) programs that run on Intel architectures (like GPUs or NPUs). Selecting this option can impact CPU performance. The ‘With stacks’ option allows you to examine the CPU-side stacks for GPU and NPU-computing tasks to investigate the efficiency of your XPU offload. When results display, use the Call Stack mode in the filter bar to sort through SYCL*, Level-Zero, or OpenCL™ runtime call stacks.
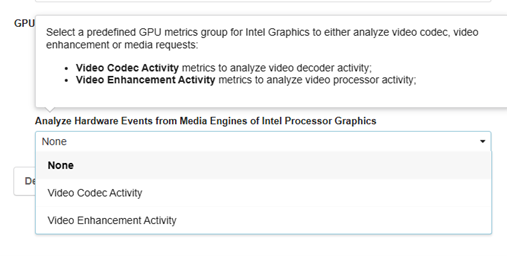
Analyze Hardware Events from Media Engines of Intel Processor Graphics – This option is available only for Intel hardware platforms that support the collection of events from media engines like Meteor Lake, Arrow Lake, Lunar Lake, Battlemage, Panther Lake. Set this option to collect and analyze Video Codec or Video Enhancement activity metrics.
NPU:
- Profile NPU - Use this option to enable or disable NPU profiling.
- NPU Collection mode - Select the mode of NPU hardware metrics collection: time- or query-based.
- NPU Sampling interval -This option appliesto time-based metrics collection only. Default sampling interval for NPU hardware metrics is 1ms.
- NPU Metrics set - Select the setof NPUmetrics. NOC metric set data includes the DDR bandwidth between the NPU and DDR memory. FCR metric set is available in time-based mode of collection only and reports NPU frequency.
- Trace computing programming APIs (with stacks) - Set this option to analyze host- and NPU-side Level-Zero calls. Selecting this option can impact CPU performance.
Click the
 Start button to run the analysis.
To run the XPU Offload analysis from the command line, type:
$ vtune -collect xpu-offload [-knob <knob_name=knob_option>] -- <target> [target_options]
To generate the command line for any analysis configuration, use the Command Line button at the bottom of the user interface.
Once VTune Profiler completes data collection, the results of the XPU Offload analysis appear in the XPU Offload viewpoint.