CPU Metrics Reference
Assists
Metric Description
This metric estimates cycles fraction the CPU retired uops delivered by the Microcode_Sequencer as a result of Assists. Assists are long sequences of uops that are required in certain corner-cases for operations that cannot be handled natively by the execution pipeline. For example, when working with very small floating point values (so-called Denormals), the FP units are not set up to perform these operations natively. Instead, a sequence of instructions to perform the computation on the Denormals is injected into the pipeline. Since these microcode sequences might be hundreds of uops long, Assists can be extremely deleterious to performance and they can be avoided in many cases.
Possible Issues
A significant portion of execution time is spent in microcode assists.
Tips:
1. Examine the FP_ASSIST and OTHER_ASSISTS events to determine the specific cause.
2. Add options eliminating x87 code and set the compiler options to enable DAZ (denormals-are-zero) and FTZ (flush-to-zero).
Available Core Time
Metric Description
Total execution time over all cores.
Average Bandwidth
Metric Description
Average bandwidth utilization during the analysis.
Average CPU Frequency
Metric Description
Average actual CPU frequency. Values above nominal frequency indicate that the CPU is operating in a turbo boost mode.
Average CPU Usage
Metric Description
The metric shows average CPU utilization by computations of the application. Spin and Overhead time are not counted. Ideal average CPU usage is equal to the number of logical CPU cores.
Average Frame Time
Metric Description
Average amount of time spent within a frame.
Average Latency (cycles)
Metric Description
This metric shows average load latency in cycles
Average Logical Core Utilization
Metric Description
The metric shows average logical cores utilization by computations of the application. Spin and Overhead time are not counted. Ideal average CPU utilization is equal to the number of logical CPU cores.
Average Physical Core Utilization
Metric Description
The metric shows average physical cores utilization by computations of the application. Spin and Overhead time are not counted. Ideal average CPU utilization is equal to the number of physical CPU cores.
Average Task Time
Metric Description
Average amount of time spent within a task.
Back-End Bound
Metric Description
Back-End Bound metric represents a Pipeline Slots fraction where no uOps are being delivered due to a lack of required resources for accepting new uOps in the Back-End. Back-End is a portion of the processor core where an out-of-order scheduler dispatches ready uOps into their respective execution units, and, once completed, these uOps get retired according to program order. For example, stalls due to data-cache misses or stalls due to the divider unit being overloaded are both categorized as Back-End Bound. Back-End Bound is further divided into two main categories: Memory Bound and Core Bound.
Possible Issues
A significant proportion of pipeline slots are remaining empty. When operations take too long in the back-end, they introduce bubbles in the pipeline that ultimately cause fewer pipeline slots containing useful work to be retired per cycle than the machine is capable of supporting. This opportunity cost results in slower execution. Long-latency operations like divides and memory operations can cause this, as can too many operations being directed to a single execution port (for example, more multiply operations arriving in the back-end per cycle than the execution unit can support).
Memory Bandwidth
Metric Description
This metric represents a fraction of cycles during which an application could be stalled due to approaching bandwidth limits of the main memory (DRAM). This metric does not aggregate requests from other threads/cores/sockets (see Uncore counters for that). Consider improving data locality in NUMA multi-socket systems.
Contested Accesses (Intra-Tile)
Metric Description
Contested accesses occur when data written by one thread is read by another thread on a different core. Examples of contested accesses include synchronizations such as locks, true data sharing such as modified locked variables, and false sharing. Contested accesses metric is a ratio of the number of contested accesses to all demand loads and stores. This metrics only accounts for contested accesses between two cores on the same tile.
Possible Issues
There is a high number of contested accesses to cachelines modified by another core. Consider either using techniques suggested for other long latency load events (for example, LLC Miss) or reducing the contested accesses. To reduce contested accesses, first identify the cause. If it is synchronization, try increasing synchronization granularity. If it is true data sharing, consider data privatization and reduction. If it is false data sharing, restructure the data to place contested variables in distinct cachelines. This may increase the working set due to padding, but false sharing can always be avoided.
LLC Miss
Metric Description
The LLC (last-level cache) is the last, and longest-latency, level in the memory hierarchy before main memory (DRAM). Any memory requests missing here must be serviced by local or remote DRAM, with significant latency. The LLC Miss metric shows a ratio of cycles with outstanding LLC misses to all cycles.
Possible Issues
A high number of CPU cycles is being spent waiting for LLC load misses to be serviced. Possible optimizations are to reduce data working set size, improve data access locality, blocking and consuming data in chunks that fit in the LLC, or better exploit hardware prefetchers. Consider using software prefetchers but they can increase latency by interfering with normal loads, and can increase pressure on the memory system.
UTLB Overhead
Metric Description
This metric represents a fraction of cycles spent on handling first-level data TLB (or UTLB) misses. As with ordinary data caching, focus on improving data locality and reducing working-set size to reduce UTLB overhead. Additionally, consider using profile-guided optimization (PGO) to collocate frequently-used data on the same page. Try using larger page sizes for large amounts of frequently-used data. This metric does not include store TLB misses.
Possible Issues
A significant proportion of cycles is being spent handling first-level data TLB misses. As with ordinary data caching, focus on improving data locality and reducing working-set size to reduce UTLB overhead. Additionally, consider using profile-guided optimization (PGO) to collocate frequently-used data on the same page. Try using larger page sizes for large amounts of frequently-used data.
Port Utilization
Metric Description
This metric represents a fraction of cycles during which an application was stalled due to Core non-divider-related issues. For example, heavy data-dependency between nearby instructions, or a sequence of instructions that overloads specific ports. Hint: Loop Vectorization - most compilers feature auto-Vectorization options today - reduces pressure on the execution ports as multiple elements are calculated with same uop.
Possible Issues
A significant fraction of cycles was stalled due to Core non-divider-related issues.
Tips
Use vectorization to reduce pressure on the execution ports as multiple elements are calculated with same uOp.
Port 0
Metric Description
This metric represents Core cycles fraction CPU dispatched uops on execution port 0 (SNB+: ALU; HSW+:ALU and 2nd branch)
Port 1
Metric Description
This metric represents Core cycles fraction CPU dispatched uops on execution port 1 (ALU)
Port 2
Metric Description
This metric represents Core cycles fraction CPU dispatched uops on execution port 2 (Loads and Store-address)
Port 3
Metric Description
This metric represents Core cycles fraction CPU dispatched uops on execution port 3 (Loads and Store-address)
Port 4
Metric Description
This metric represents Core cycles fraction CPU dispatched uops on execution port 4 (Store-data)
Possible Issues
This metric represents Core cycles fraction CPU dispatched uops on execution port 4 (Store-data). Note that this metric value may be highlighted due to Split Stores issue.
Port 5
Metric Description
This metric represents Core cycles fraction CPU dispatched uops on execution port 5 (SNB+: Branches and ALU; HSW+: ALU)
Port 6
Metric Description
This metric represents Core cycles fraction CPU dispatched uops on execution port 6 (Branches and simple ALU)
Port 7
Metric Description
This metric represents Core cycles fraction CPU dispatched uops on execution port 7 (simple Store-address)
BACLEARS
Metric Description
This metric estimates a fraction of cycles lost due to the Branch Target Buffer (BTB) prediction corrected by a later branch predictor.
Possible Issues
A significant number of CPU cycles lost due to the Branch Target Buffer (BTB) prediction corrected by a later branch predictor. Consider reducing the amount of taken branches.
Bad Speculation (Cancelled Pipeline Slots)
Metric Description
Bad Speculation represents a Pipeline Slots fraction wasted due to incorrect speculations. This includes slots used to issue uOps that do not eventually get retired and slots for which the issue-pipeline was blocked due to recovery from an earlier incorrect speculation. For example, wasted work due to mispredicted branches is categorized as a Bad Speculation category. Incorrect data speculation followed by Memory Ordering Nukes is another example.
Possible Issues
A significant proportion of pipeline slots containing useful work are being cancelled. This can be caused by mispredicting branches or by machine clears. Note that this metric value may be highlighted due to Branch Resteers issue.
Bad Speculation (Back-End Bound Pipeline Slots)
Metric Description
Superscalar processors can be conceptually divided into the 'front-end', where instructions are fetched and decoded into the operations that constitute them; and the 'back-end', where the required computation is performed. Each cycle, the front-end generates up to four of these operations placed into pipeline slots that then move through the back-end. Thus, for a given execution duration in clock cycles, it is easy to determine the maximum number of pipeline slots containing useful work that can be retired in that duration. The actual number of retired pipeline slots containing useful work, though, rarely equals this maximum. This can be due to several factors: some pipeline slots cannot be filled with useful work, either because the front-end could not fetch or decode instructions in time ('Front-end bound' execution) or because the back-end was not prepared to accept more operations of a certain kind ('Back-end bound' execution). Moreover, even pipeline slots that do contain useful work may not retire due to bad speculation. Front-end bound execution may be due to a large code working set, poor code layout, or microcode assists. Back-end bound execution may be due to long-latency operations or other contention for execution resources. Bad speculation is most frequently due to branch misprediction.
Possible Issues
A significant proportion of pipeline slots are remaining empty. When operations take too long in the back-end, they introduce bubbles in the pipeline that ultimately cause fewer pipeline slots containing useful work to be retired per cycle than the machine is capable of supporting. This opportunity cost results in slower execution. Long-latency operations like divides and memory operations can cause this, as can too many operations being directed to a single execution port (for example, more multiply operations arriving in the back-end per cycle than the execution unit can support).
FP Arithmetic
Metric Description
This metric represents an overall arithmetic floating-point (FP) uOps fraction the CPU has executed (retired).
FP Assists
Metric Description
Certain floating point operations cannot be handled natively by the execution pipeline and must be performed by microcode (small programs injected into the execution stream). For example, when working with very small floating point values (so-called denormals), the floating-point units are not set up to perform these operations natively. Instead, a sequence of instructions to perform the computation on the denormal is injected into the pipeline. Since these microcode sequences might be hundreds of instructions long, these microcode assists are extremely deleterious to performance.
Possible Issues
A significant portion of execution time is spent in floating point assists.
Tips
Consider enabling the DAZ (Denormals Are Zero) and/or FTZ (Flush To Zero) options in your compiler to flush denormals to zero. This option may improve performance if the denormal values are not critical in your application. Also note that the DAZ and FTZ modes are not compatible with the IEEE Standard 754.
FP Scalar
Metric Description
This metric represents an arithmetic floating-point (FP) scalar uops fraction the CPU has executed. Analyze metric values to identify why vector code is not generated, which is typically caused by the selected algorithm or missing/wrong compiler switches.
FP Vector
Metric Description
This metric represents an arithmetic floating-point (FP) vector uops fraction the CPU has executed. Make sure vector width is expected.
FP x87
Metric Description
This metric represents a floating-point (FP) x87 uops fraction the CPU has executed. It accounts for instructions beyond X87 FP arithmetic operations; hence may be used as a thermometer to avoid X87 high usage and preferably upgrade to modern ISA. Consider compiler flags to generate newer AVX (or SSE) instruction sets, which typically perform better and feature vectors.
MS Assists
Metric Description
Certain corner-case operations cannot be handled natively by the execution pipeline and must be performed by the microcode sequencer (MS), where 1 or more uOps are issued. The microcode sequencer performs microcode assists (small programs injected into the execution stream), inserting flows, and writing to the instruction queue (IQ). For example, when working with very small floating point values (so-called denormals), the floating-point units are not set up to perform these operations natively. Instead, a sequence of instructions to perform the computation on the denormal is injected into the pipeline. Since these microcode sequences might be hundreds of instructions long, these microcode assists are extremely deleterious to performance.
Possible Issues
A significant portion of execution time is spent in microcode assists, inserted flows, and writing to the instruction queue (IQ). Examine the FP Assist and SIMD Assist metrics to determine the specific cause.
Branch Mispredict
Metric Description
When a branch mispredicts, some instructions from the mispredicted path still move through the pipeline. All work performed on these instructions is wasted since they would not have been executed had the branch been correctly predicted. This metric represents slots fraction the CPU has wasted due to Branch Misprediction. These slots are either wasted by uOps fetched from an incorrectly speculated program path, or stalls when the out-of-order part of the machine needs to recover its state from a speculative path.
Possible Issues
A significant proportion of branches are mispredicted, leading to excessive wasted work or Back-End stalls due to the machine need to recover its state from a speculative path.
Tips
1. Identify heavily mispredicted branches and consider making your algorithm more predictable or reducing the number of branches. You can add more work to 'if' statements and move them higher in the code flow for earlier execution. If using 'switch' or 'case' statements, put the most commonly executed cases first. Avoid using virtual function pointers for heavily executed calls.
2. Use profile-guided optimization in the compiler.
See the Intel 64 and IA-32 Architectures Optimization Reference Manual for general strategies to address branch misprediction issues.
Bus Lock
Metric Description
Intel processors provide a LOCK# signal that is asserted automatically during certain critical memory operations to lock the system bus or equivalent link. While this output signal is asserted, requests from other processors or bus agents for control of the bus are blocked. This metric measures the ratio of bus cycles, during which a LOCK# signal is asserted on the bus. The LOCK# signal is asserted when there is a locked memory access due to uncacheable memory, locked operation that spans two cache lines, and page-walk from an uncacheable page table.
Possible Issues
Bus locks have a very high performance penalty. It is highly recommended to avoid locked memory accesses to improve memory concurrency.
Tips
Examine the BUS_LOCK_CLOCKS.SELF event in the source/assembly view to determine where the LOCK# signals are asserted from. If they come from themselves, look at Back-end issues, such as memory latency or reissues. Account for skid.
Cache Bound
Metric Description
This metric shows how often the machine was stalled on L1, L2, and L3 caches. While cache hits are serviced much more quickly than hits in DRAM, they can still incur a significant performance penalty. This metric also includes coherence penalties for shared data.
Possible Issues
A significant proportion of cycles are being spent on data fetches from caches. Check Memory Access analysis to see if accesses to L2 or L3 caches are problematic and consider applying the same performance tuning as you would for a cache-missing workload. This may include reducing the data working set size, improving data access locality, blocking or partitioning the working set to fit in the lower cache levels, or exploiting hardware prefetchers. Consider using software prefetchers, but note that they can interfere with normal loads, increase latency, and increase pressure on the memory system. This metric includes coherence penalties for shared data. Check Microarchitecture Exploration analysis to see if contested accesses or data sharing are indicated as likely issues.
Clears Resteers
Metric Description
This metric measures the fraction of cycles the CPU was stalled due to Branch Resteers as a result of Machine Clears.
Possible Issues
A significant fraction of cycles could be stalled due to Branch Resteers as a result of Machine Clears.
Clockticks per Instructions Retired (CPI)
Metric Description
Clockticks per Instructions Retired (CPI) event ratio, also known as Cycles per Instructions, is one of the basic performance metrics for the hardware event-based sampling collection, also known as Performance Monitoring Counter (PMC) analysis in the sampling mode. This ratio is calculated by dividing the number of unhalted processor cycles (Clockticks) by the number of instructions retired. On each processor the exact events used to count clockticks and instructions retired may be different, but VTune Profiler knows the correct ones to use.
What is the significance of CPI?
The CPI value of an application or function is an indication of how much latency affected its execution. Higher CPI values mean there was more latency in your system - on average, it took more clockticks for an instruction to retire. Latency in your system can be caused by cache misses, I/O, or other bottlenecks.
When you want to determine where to focus your performance tuning effort, the CPI is the first metric to check. A good CPI rate indicates that the code is executing optimally.
The main way to use CPI is by comparing a current CPI value to a baseline CPI for the same workload. For example, suppose you made a change to your system or your code and then ran the VTune Profiler and collected CPI. If the performance of the application decreased after the change, one way to understand what may have happened is to look for functions where CPI increased. If you have made an optimization that improved the runtime of your application, you can look at VTune Profiler data to see if CPI decreased. If it did, you can use that information to help direct you toward further investigations. What caused CPI to decrease? Was it a reduction in cache misses, fewer memory operations, lower memory latency, and so on.
How do I know when CPI is high?
The CPI of a workload depends both on the code, the processor, and the system configuration.
VTune Profiler analyzes the CPI value against the threshold set up by Intel architects. These numbers can be used as a general guide:
Good |
Poor |
|---|---|
0.75 |
4 |
A CPI < 1 is typical for instruction bound code, while a CPI > 1 may show up for a stall cycle bound application, also likely memory bound.
If a CPI value exceeds the threshold, the VTune Profiler highlights this value in pink.
A high value for this ratio (>1) indicates that over the current code region, instructions are taking a high number of processor clocks to execute. This could indicate a problem if most of the instructions are not predominately high latency instructions and/or coming from microcode ROM. In this case there may be opportunities to modify your code to improve the efficiency with which instructions are executed within the processor.
For processors with Inte® Hyper-Threading Technology, this ratio measures the CPI for the phases where the physical package is not in any sleep mode, that is, at least one logical processor in the physical package is in use. Clockticks are continuously counted on logical processors even if the logical processor is in a halted stated (not executing instructions). This can impact the logical processors CPI ratio because the Clockticks event continues to be accumulated while the Instructions Retired event is unchanged. A high CPI value still indicates a performance problem however a high CPI value on a specific logical processor could indicate poor CPU usage and not an execution problem.
If your application is threaded, CPI at all code levels is affected. The Clockticks event counts independently on each logical processors parallel execution is not accounted for.
For example, consider the following:
Function XYZ on logical processor 0 |------------------------| 4000 Clockticks / 1000 Instructions
Function XYZ on logical processor 1 |------------------------| 4000 Clockticks / 1000 Instructions
The CPI for the function XYZ is ( 8000 / 2000 ) 4.0. If parallel execution is taken into account in Clockticks the CPI would be ( 4000 / 2000 ) 2.0. Knowledge of the application behavior is necessary in interpreting the Clockticks event data.
What are the pitfalls of using CPI?
CPI can be misleading, so you should understand the pitfalls. CPI (latency) is not the only factor affecting the performance of your code on your system. The other major factor is the number of instructions executed (sometimes called path length). All optimizations or changes you make to your code will affect either the time to execute instructions (CPI) or the number of instructions to execute, or both. Using CPI without considering the number of instructions executed can lead to an incorrect interpretation of your results. For example, you vectorized your code and converted your math operations to operate on multiple pieces of data at once. This would have the effect of replacing many single-data math instructions with fewer multiple-data math instructions. This would reduce the number of instructions executed overall in your code, but it would likely raise your CPI because multiple-data instructions are more complex and take longer to execute. In many cases, this vectorization would increase your performance, even though CPI went up.
It is important to be aware of your total instructions executed as well. The number of instructions executed is generally called INST_RETIRED in the VTune Profiler. If your instructions retired is remaining fairly constant, CPI can be a good indicator of performance (this is the case with system tuning, for example). If both the number of instructions and CPI are changing, you need to look at both metrics to understand why your performance increased or decreased. Finally, an alternative to looking at CPI is applying the top-down method.
Clockticks Vs. Pipeline Slots Based Metrics
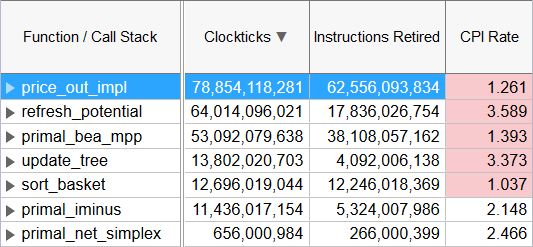
CPI Rate
Metric Description
Cycles per Instruction Retired, or CPI, is a fundamental performance metric indicating approximately how much time each executed instruction took, in units of cycles. Modern superscalar processors issue up to four instructions per cycle, suggesting a theoretical best CPI of 0.25. But various effects (long-latency memory, floating-point, or SIMD operations; non-retired instructions due to branch mispredictions; instruction starvation in the front-end) tend to pull the observed CPI up. A CPI of 1 is generally considered acceptable for HPC applications but different application domains will have very different expected values. Nonetheless, CPI is an excellent metric for judging an overall potential for application performance tuning.
Intel® VTune™ Profiler provides hardware event-based metrics for the Microarchitecture Exploration analysis measured either as Clockticks or Pipeline Slots. To understand the difference, consider the following example:
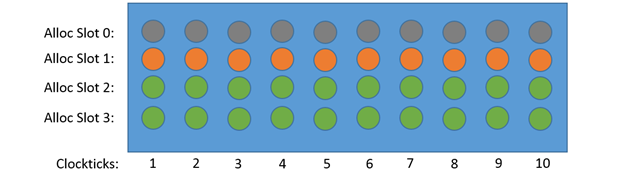
Here the two slots are wasted on each cycle, which is 50% in terms of Pipeline Slots. But in terms of Clockticks, the stall metrics will be 100% since on each cycle there is some stall. Moreover, on each cycle there may be stalls due to different reasons, which means that metrics measured in Clockticks may overlap.
So, metrics measured in Clockticks are less precise compared to the metrics measured in Pipeline Slots since they may overlap and their sum at some level does not necessarily match the parent metric value. But these metrics are still useful for identifying the dominant performance bottleneck in the code.
Possible Issues
The CPI may be too high. This could be caused by issues such as memory stalls, instruction starvation, branch misprediction or long latency instructions. Explore the other hardware-related metrics to identify what is causing high CPI.
CPI Rate (Intel Atom® processor)
Metric Description
Cycles per Instructions Retired is a fundamental performance metric indicating an average amount of time each instruction took to execute, in units of cycles. For Intel Atom processors, the theoretical best CPI per thread is 0.50, but CPI's over 2.0 warrant investigation. High CPI values may indicate latency in the system that could be reduced such as long-latency memory, floating-point operations, non-retired instructions due to branch mispredictions, or instruction starvation in the front-end. Beware that some optimizations such as SIMD will use less instructions per cycle (increasing CPI), and debug code can use redundant instructions creating more instructions per cycle (decreasing CPI).
Possible Issues
The CPI may be too high. This could be caused by issues such as memory stalls, instruction starvation, branch misprediction or long latency instructions. Explore the other hardware-related metrics to identify what is causing high CPI.
CPU Time
Metric Description
CPU Time is time during which the CPU is actively executing your application.
Core Bound
Metric Description
This metric represents how much Core non-memory issues were of a bottleneck. Shortage in hardware compute resources, or dependencies software's instructions are both categorized under Core Bound. Hence it may indicate the machine ran out of an OOO resources, certain execution units are overloaded or dependencies in program's data- or instruction- flow are limiting the performance (e.g. FP-chained long-latency arithmetic operations).
CPU Frequency
Metric Description
Frequency calculated with APERF/MPERF MSR registers captured on the clockcycles event.
It is a software frequency showing the average logical core frequency between two samples. The smaller the sampling interval is, the closer the metric is to the real HW frequency.
CPU Time
Metric Description
CPU Time is time during which the CPU is actively executing your application.
CPU Utilization
Metric Description
This metric evaluates the parallel efficiency of your application. It estimates the percentage of all the logical CPU cores in the system that is used by your application -- without including the overhead introduced by the parallel runtime system. 100% utilization means that your application keeps all the logical CPU cores busy for the entire time that it runs.
Depending on the analysis type, you can see the CPU Utilization data in the Bottom-up grid (HPC Performance Characterization), on the Timeline pane, and in the Summary window on the Effective CPU Utilization histogram:
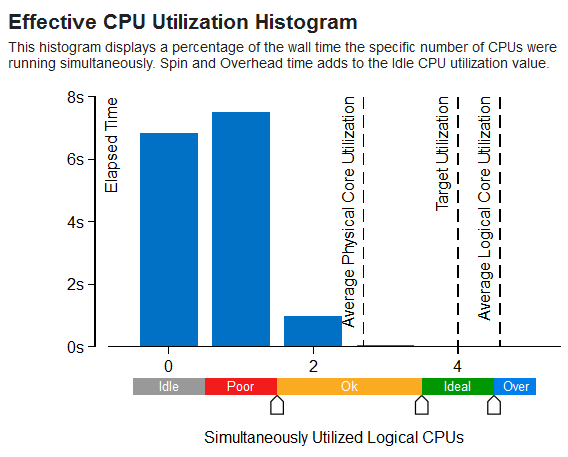
Utilization Histogram
For the histogram, the Intel® VTune™ Profiler identifies a processor utilization scale, calculates the target CPU utilization, and defines default utilization ranges depending on the number of processor cores. You can change the utilization ranges by dragging the sliders, if required.
Utilization Type |
Default color |
Description |
|---|---|---|
Idle |
|
Idle utilization. By default, if the CPU Time on all threads is less than 0.5 of 100% CPU Time on 1 core, such CPU utilization is classified as idle. Formula: Σi=1,ThreadsCount(CPUTime(T,i)/T) < 0.5, where CPUTime(T,i) is the total CPU Time on thread i on interval T. |
Poor |
|
Poor utilization. By default, poor utilization is when the number of simultaneously running CPUs is less than or equal to 50% of the target CPU utilization. |
OK |
|
Acceptable (OK) utilization. By default, OK usage is when the number of simultaneously running CPUs is between 51-85% of the target CPU utilization. |
Ideal |
|
Ideal utilization. By default, Ideal utilization is when the number of simultaneously running CPUs is between 86-100% of the target CPU utilization. |
VTune Profiler treats the Spin and Overhead time as Idle CPU utilization. Different analysis types may recognize Spin and Overhead time differently depending on availability of call stack information. This may result in a difference of CPU Utilization graphical representation per analysis type.
For the HPC Performance Characterization analysis, the VTune Profiler differentiates Effective Physical Core Utilization vs. Effective Logical Core Utilization for all systems other than Inte® Xeon Phi processors code named Knights Mill and Knights Landing.
For Intel® Xeon Phi processors code named Knights Mill and Knights Landing, as well as systems with Intel Hyper-Threading Technology (Intel HT Technology) OFF, only generic Effective CPU Utilization metric is provided.
CPU Utilization vs. Thread Efficiency
CPU Utilization may be higher than the Thread Efficiency (available for Threading analysis) if a thread is executing code on a CPU while it is logically waiting (that is, the thread is spinning).
CPU Utilization may be lower than the Thread Efficiency if:
The concurrency level is higher than the number of available cores (oversubscription) and, thus, reaching this level of CPU utilization is not possible. Generally, large oversubscription negatively impacts the application performance since it causes excessive context switching.
There was a period when the profiled process was swapped out. Thus, while it was not logically waiting, it was not scheduled for any CPU either.
Possible Issues
The metric value is low, which may signal a poor logical CPU cores utilization caused by load imbalance, threading runtime overhead, contended synchronization, or thread/process underutilization. Explore CPU Utilization sub-metrics to estimate the efficiency of MPI and OpenMP parallelism or run the Threading analysis to identify parallel bottlenecks for other parallel runtimes.
CPU Utilization (OpenMP)
Metric Description
This metric represents how efficiently the application utilized the CPUs available and helps evaluate the parallel efficiency of the application. It shows the percent of average CPU utilization by all logical CPUs on the system. Average CPU utilization contains only effective time and does not contain spin and overhead. A CPU utilization of 100% means that all of the logical CPUs were loaded by computations of the application.
Possible Issues
The metric value is low, which may signal a poor logical CPU cores utilization caused by load imbalance, threading runtime overhead, contended synchronization, or thread/process underutilization. Explore CPU Utilization sub-metrics to estimate the efficiency of MPI and OpenMP parallelism or run the Threading analysis to identify parallel bottlenecks for other parallel runtimes.
Cycles of 0 Ports Utilized
Metric Description
This metric represents a fraction of cycles with no uOps executed by the CPU on any execution port. Long-latency instructions like divides may contribute to this metric.
Possible Issues
CPU executed no uOps on any execution port during a significant fraction of cycles. Long-latency instructions like divides may contribute to this issue. Check the Assembly view and Appendix C in the Optimization Guide to identify instructions with 5 or more cycles latency.
Cycles of 1 Port Utilized
Metric Description
This metric represents cycles fraction where the CPU executed total of 1 uop per cycle on all execution ports. This can be due to heavy data-dependency among software instructions, or oversubscribing a particular hardware resource. In some other cases with high 1_Port_Utilized and L1 Bound, this metric can point to L1 data-cache latency bottleneck that may not necessarily manifest with complete execution starvation (due to the short L1 latency e.g. walking a linked list) - looking at the assembly can be helpful.
Possible Issues
This metric represents cycles fraction where the CPU executed total of 1 uop per cycle on all execution ports. This can be due to heavy data-dependency among software instructions, or oversubscribing a particular hardware resource. In some other cases with high 1_Port_Utilized and L1 Bound, this metric can point to L1 data-cache latency bottleneck that may not necessarily manifest with complete execution starvation (due to the short L1 latency e.g. walking a linked list) - looking at the assembly can be helpful. Note that this metric value may be highlighted due to L1 Bound issue.
Cycles of 2 Ports Utilized
Metric Description
This metric represents cycles fraction CPU executed total of 2 uops per cycle on all execution ports. Tip: Loop Vectorization - most compilers feature auto-Vectorization options today- reduces pressure on the execution ports as multiple elements are calculated with same uop.
Cycles of 3+ Ports Utilized
Metric Description
This metric represents Core cycles fraction CPU executed total of 3 or more uops per cycle on all execution ports.
Divider
Metric Description
Not all arithmetic operations take the same amount of time. Divides and square roots, both performed by the DIV unit, take considerably longer than integer or floating point addition, subtraction, or multiplication. This metric represents cycles fraction where the Divider unit was active.
Possible Issues
The DIV unit is active for a significant portion of execution time.
Tips
Locate the hot long-latency operation(s) and try to eliminate them. For example, if dividing by a constant, consider replacing the divide by a product of the inverse of the constant. If dividing an integer, consider using a right-shift instead.
(Info) DSB Coverage
Metric Description
Fraction of uOps delivered by the DSB (known as Decoded ICache or uOp Cache).
Possible Issues
A significant fraction of uOps was not delivered by the DSB (known as Decoded ICache or uOp Cache). This may happen if a hot code region is too large to fit into the DSB.
Tips
Consider changing the code layout (for example, via profile-guided optimization) to help your hot regions fit into the DSB.
See the "Optimization for Decoded ICache" section in the Intel 64 and IA-32 Architectures Optimization Reference Manual.
DTLB Store Overhead
Metric Description
This metric represents a fraction of cycles spent on handling first-level data TLB store misses. As with ordinary data caching, focus on improving data locality and reducing working-set size to reduce DTLB overhead. Additionally, consider using profile-guided optimization (PGO) to collocate frequently-used data on the same page. Try using larger page sizes for large amounts of frequently-used data.
Effective CPU Utilization
Metric Description
How many of the logical CPU cores are used by your application? This metric helps evaluate the parallel efficiency of your application. It estimates the percentage of all the logical CPU cores in the system that is spent in your application -- without including the overhead introduced by the parallel runtime system. 100% utilization means that your application keeps all the logical CPU cores busy for the entire time that it runs.
Effective Physical Core Utilization
Metric Description
This metric represents how efficiently the application utilized the physical CPU cores available and helps evaluate the parallel efficiency of the application. It shows the percent of average utilization by all physical CPU cores on the system. Effective Physical Core Utilization contains only effective time and does not contain spin and overhead. An utilization of 100% means that all of the physical CPU cores were loaded by computations of the application.
Possible Issues
The metric value is low, which may signal a poor physical CPU cores utilization caused by:
- load imbalance
- threading runtime overhead
- contended synchronization
- thread/process underutilization
- incorrect affinity that utilizes logical cores instead of physical cores
Effective Time
Metric Description
Effective Time is CPU time spent in the user code. This metric does not include Spin and Overhead time.
Elapsed Time
Metric Description
Elapsed time is the wall time from the beginning to the end of collection.
Elapsed Time (Global)
Metric Description
Elapsed time is the wall time from the beginning to the end of collection.
Elapsed Time (Total)
Metric Description
Elapsed time is the wall time from the beginning to the end of collection.
Estimated BB Execution Count
Metric Description
Statistical estimation of the basic block execution count.
Estimated Ideal Time
Metric Description
Ideal Time is the estimated time for all parallel regions potentially load-balanced with zero OpenMP runtime overhead according to the formula: Total User CPU time in all regions/Number of OpenMP threads.
Execution Stalls
Metric Description
Execution stalls may signify that a machine is running at full capacity, with no computation resources wasted. Sometimes, however, long-latency operations can serialize while waiting for critical computation resources. This metric is the ratio of cycles with no micro-operations executed to all cycles.
Possible Issues
The percentage of cycles with no micro-operations executed is high. Look for long-latency operations at code regions with high execution stalls and try to use alternative methods or lower latency operations. For example, consider replacing 'div' operations with right-shifts, or try to reduce the latency of memory accesses.
False Sharing
Metric Description
This metric shows how often CPU was stalled on store operations to a shared cache line. It can be easily avoided by padding to make threads access different lines.
Far Branch
Metric Description
This metric indicates when a call/return is using a far pointer. A far call is often used to transfer from user code to privileged code.
Possible Issues
Transferring from user to privileged code may be too frequent. Consider reducing calls to system APIs.
Flags Merge Stalls
Metric Description
Shift cl operations require a potentially expensive flag merge. This metric estimates the performance penalty of that merge.
Possible Issues
A significant proportion of cycles were spent handling flags merge operations. Use the source view to discover the responsible instructions and try to avoid their use.
FPU Utilization
Metric Description
This metric represents how intensively your program uses the FPU. 100% means that the FPU is fully loaded and is retiring a vector instruction with full capacity every cycle of the application execution.
Possible Issues
The metric value is low. This can indicate poor FPU utilization because of non-vectorized floating point operations, or inefficient vectorization due to legacy vector instruction set or memory access pattern issues. Consider using vector analysis in Intel Advisor for data and tips to improve vectorization efficiency in your application.
% of Packed FP Instructions
Metric Description
This metric represents the percentage of all packed floating point instructions.
% of 128-bit Packed Floating Point Instructions
Metric Description
The metric represents % of 128-bit packed floating point instructions.
% of 256-bit Packed Floating Point Instructions
Metric Description
The metric represents % of 256-bit packed floating point instructions.
% of Packed SIMD Instructions
Metric Description
This metric represents the percentage of all packed floating point instructions.
% of Scalar FP Instructions
Metric Description
This metric represents the percentage of scalar floating point instructions.
% of Scalar SIMD Instructions
Metric Description
The metric represents the percentage of scalar SIMD instructions.
FP Arithmetic/Memory Read Instructions Ratio
Metric Description
This metric represents the ratio between arithmetic floating point instructions and memory read instructions. A value less than 0.5 indicates unaligned data access for vector operations, which can negatively impact the performance of vector instruction execution.
FP Arithmetic/Memory Write Instructions Ratio
Metric Description
This metric represents the ratio between arithmetic floating point instructions and memory write instructions. A value less than 0.5 indicates unaligned data access for vector operations, which can negatively impact the performance of vector instruction execution.
Loop Type
Metric Description
Displays a loop type (body, peel, reminder) based on the Intel Compiler optreport information.
SP FLOPs per Cycle
Metric Description
Number of single precision floating point operations (FLOPs) per clocktick. This metric shows the efficiency of both vector code generation and execution. Explore the list of generated issues on the metric to see the reasons behind the low FLOP numbers. The maximum number of FLOPs per cycle depends on your hardware platform. All double operations are converted to two single operations.
Vector Capacity Usage
Metric Description
This metric represents how the application code vectorization relates to the floating point computations. A value of 100% means that all floating point instructions are vectorized with the full vector capacity.
Vector Instruction Set
Metric Description
Displays the Vector Instruction Set used for arithmetic floating point computations and memory access operations.
Possible Issues
You are not using a modern vectorization instruction set. Consider recompiling your code using compiler options that allow using a modern vectorization instruction set. See the compiler User and Reference Guide for C++ or Fortran for more details.
Front-End Bandwidth
Metric Description
This metric represents a fraction of slots during which CPU was stalled due to front-end bandwidth issues, such as inefficiencies in the instruction decoders or code restrictions for caching in the DSB (decoded uOps cache). In such cases, the front-end typically delivers a non-optimal amount of uOps to the back-end.
Front-End Bandwidth DSB
Metric Description
This metric represents a fraction of cycles during which CPU was likely limited due to DSB (decoded uop cache) fetch pipeline. For example, inefficient utilization of the DSB cache structure or bank conflict when reading from it, are categorized here.
Front-End Bandwidth LSD
Metric Description
This metric represents a fraction of cycles during which CPU operation was limited by the LSD (Loop Stream Detector) unit. Typically, LSD provides good uOp supply. However, in some rare cases, optimal uOp delivery cannot be reached for small loops whose size (in terms of number of uOps) does not suit well the LSD structure.
Possible Issues
A significant number of CPU cycles is spent waiting for uOps for the LSD (Loop Stream Detector) unit. Typically, LSD provides good uOp support. However, in some rare cases, optimal uOp delivery cannot be reached for small loops whose size (in terms of number of uOps) does not suit well the LSD structure.
Front-End Bandwidth MITE
Metric Description
This metric represents a fraction of cycles during which CPU was stalled due to the MITE fetch pipeline issues, such as inefficiencies in the instruction decoders.
Front-End Bound
Metric Description
Front-End Bound metric represents a slots fraction where the processor's Front-End undersupplies its Back-End. Front-End denotes the first part of the processor core responsible for fetching operations that are executed later on by the Back-End part. Within the Front-End, a branch predictor predicts the next address to fetch, cache-lines are fetched from the memory subsystem, parsed into instructions, and lastly decoded into micro-ops (uOps). Front-End Bound metric denotes unutilized issue-slots when there is no Back-End stall (bubbles where Front-End delivered no uOps while Back-End could have accepted them). For example, stalls due to instruction-cache misses would be categorized as Front-End Bound.
Possible Issues
A significant portion of Pipeline Slots is remaining empty due to issues in the Front-End.
Tips
Make sure the code working size is not too large, the code layout does not require too many memory accesses per cycle to get enough instructions for filling four pipeline slots, or check for microcode assists.
Front-End Other
Metric Description
This metric accounts for those slots that were not delivered by the front-end and do not count as a common front-end stall.
Possible Issues
The front-end did not deliver a significant portion of pipeline slots that do not classify as a common front-end stall.
Branch Resteers
Metric Description
This metric represents cycles fraction the CPU was stalled due to Branch Resteers.
Possible Issues
A significant fraction of cycles was stalled due to Branch Resteers. Branch Resteers estimate the Front-End delay in fetching operations from corrected path, following all sorts of mispredicted branches. For example, branchy code with lots of mispredictions might get categorized as Branch Resteers. Note the value of this node may overlap its siblings.
DSB Switches
Metric Description
The Decoded Stream Buffer (DSB) cache stores uOps that have already been decoded. This helps to avoid several penalties of the legacy decode pipeline, called the MITE (Micro-instruction Translation Engine). However, when control flows out of the region cached in the DSB, the front-end incurs a penalty as uOp issue switches from the DSB to the MITE. The DSB Switches metric measures this penalty.
Possible Issues
A significant portion of cycles is spent switching from the DSB to the MITE. This may happen if a hot code region is too large to fit into the DSB.
Tips
Consider changing code layout (for example, via profile-guided optimization) to help your hot regions fit into the DSB.
See the "Optimization for Decoded ICache" section in the Intel 64 and IA-32 Architectures Optimization Reference Manual for more details.
ICache Misses
Metric Description
To introduce new uOps into the pipeline, the core must either fetch them from a decoded instruction cache, or fetch the instructions themselves from memory and then decode them. In the latter path, the requests to memory first go through the L1I (level 1 instruction) cache that caches the recent code working set. Front-end stalls can accrue when fetched instructions are not present in the L1I. Possible reasons are a large code working set or fragmentation between hot and cold code. In the latter case, when a hot instruction is fetched into the L1I, any cold code on its cache line is brought along with it. This may result in the eviction of other, hotter code.
Possible Issues
A significant proportion of instruction fetches are missing in the instruction cache.
Tips
1. Use profile-guided optimization to reduce the size of hot code regions.
2. Consider compiler options to reorder functions so that hot functions are located together.
3. If your application makes significant use of macros, try to reduce this by either converting the relevant macros to functions or using linker options to eliminate repeated code.
4. Consider the Os/O1 optimization level or the following subset of optimizations to decrease your code footprint:
Use inlining only when it decreases the footprint.
Disable loop unrolling.
Disable intrinsic inlining.
ITLB Overhead
Metric Description
In x86 architectures, mappings between virtual and physical memory are facilitated by a page table, which is kept in memory. To minimize references to this table, recently-used portions of the page table are cached in a hierarchy of 'translation look-aside buffers', or TLBs, which are consulted on every virtual address translation. As with data caches, the farther a request has to go to be satisfied, the worse the performance impact. This metric estimates the performance penalty of page walks induced on ITLB (instruction TLB) misses.
Possible Issues
A significant proportion of cycles is spent handling instruction TLB misses.
Tips
1. Use profile-guided optimization and IPO to reduce the size of hot code regions.
2. Consider compiler options to reorder functions so that hot functions are located together.
3. If your application makes significant use of macros, try to reduce this by either converting the relevant macros to functions or using linker options to eliminate repeated code.
4. For Windows targets, add function splitting.
5. Consider using large code pages.
Length Changing Prefixes
Metric Description
This metric represents a fraction of cycles during which CPU was stalled due to Length Changing Prefixes (LCPs). To avoid this issue, use proper compiler flags. Intel Compiler enables these flags by default.
Possible Issues
This metric represents a fraction of cycles during which CPU was stalled due to Length Changing Prefixes (LCPs).
Tips
To avoid this issue, use proper compiler flags. Intel Compiler enables these flags by default.
See the "Length-Changing Prefixes (LCP)" section in the Intel 64 and IA-32 Architectures Optimization Reference Manual.
MS Switches
Metric Description
This metric represents a fraction of cycles when the CPU was stalled due to switches of uop delivery to the Microcode Sequencer (MS). Commonly used instructions are optimized for delivery by the DSB or MITE pipelines. Certain operations cannot be handled natively by the execution pipeline, and must be performed by microcode (small programs injected into the execution stream). Switching to the MS too often can negatively impact performance. The MS is designated to deliver long uOp flows required by CISC instructions like CPUID, or uncommon conditions like Floating Point Assists when dealing with Denormals.
Possible Issues
A significant fraction of cycles was stalled due to switches of uOp delivery to the Microcode Sequencer (MS). Commonly used instructions are optimized for delivery by the DSB or MITE pipelines. Certain operations cannot be handled natively by the execution pipeline, and must be performed by microcode (small programs injected into the execution stream). Switching to the MS too often can negatively impact performance. The MS is designated to deliver long uOp flows required by CISC instructions like CPUID, or uncommon conditions like Floating Point Assists when dealing with Denormals. Note that this metric value may be highlighted due to Microcode Sequencer issue.
Front-End Latency
Metric Description
This metric represents a fraction of slots during which CPU was stalled due to front-end latency issues, such as instruction-cache misses, ITLB misses or fetch stalls after a branch misprediction. In such cases, the front-end delivers no uOps.
General Retirement
Metric Description
This metric represents a fraction of slots during which CPU was retiring uOps not originated from the Microcode Sequencer. This correlates with the total number of instructions executed by the program. A uOps-per-Instruction ratio of 1 is expected. While this is the most desirable of the top 4 categories, high values may still indicate areas for improvement. If possible focus on techniques that reduce instruction count or result in more efficient instructions generation such as vectorization.
Hardware Event Count
Hardware Event Sample Count
ICache Line Fetch
Metric Description
This metric estimates a fraction of cycles lost due to the instruction cacheline fetching.
Possible Issues
A significant number of CPU cycles lost due to the instruction cacheline fetching.
Ideal Time
Metric Description
Ideal Time is the estimated time for all parallel regions potentially load-balanced with zero OpenMP runtime overhead according to the formula: Total User CPU time in all regions/Number of OpenMP threads.
Imbalance or Serial Spinning
Metric Description
Imbalance or Serial Spin time is wall time when working threads are spinning on a synchronization barrier consuming CPU resources. High metric value on parallel regions can be caused by load imbalance or inefficient concurrency of all working threads. To address load imbalance, consider applying dynamic work scheduling. High metric value on serial execution (Serial - outside any region) can indicate that serial application time is significant and limiting efficient processor utilization. Explore options for parallelization, algorithm or microarchitecture tuning of the serial part of the application.
Possible Issues
CPU time spent waiting on an OpenMP barrier inside of a parallel region can be a result of load imbalance. Where relevant, try dynamic work scheduling to reduce the imbalance. High metric value on serial execution (Serial - outside any region) may signal significant serial application time that is limiting efficient processor utilization. Explore options for parallelization, algorithm or microarchitecture tuning of the serial part of the application.
Inactive Sync Wait Count
Metric Description
Inactive Sync Wait Count is the number of context switches a thread experiences when it is excluded from execution by the OS scheduler due to synchronization. Excessive number of thread context switches may negatively impact application performance. Apply optimization techniques to reduce synchronization contention and eliminate the problem.
Inactive Sync Wait Time
Metric Description
Inactive Sync Wait Time is the time when a thread remains inactive and excluded from execution by the OS scheduler due to synchronization. Significant Inactive Sync Wait Time on the critical path of an application execution, combined with a poor CPU Utilization, negatively impacts application parallelism. Explore wait stacks to identify contended synchronization objects and apply optimization techniques to reduce the contention.
Possible Issues
Avarage wait time per synchronization context switch is low that can signal high contended synchronization between threads or inefficient use of system API
Inactive Time
Metric Description
The time while threads were preempted by the system and remained inactive.
Inactive Wait Count
Metric Description
Inactive Wait Count is the number of context switches a thread experiences when it is excluded from execution by the OS scheduler due to either synchronization or preemption. Excessive number of thread context switches may negatively impact application performance. Reduce synchronization contention to minimize synchronization context switches, or eliminate thread oversubscription to minimize thread preemption.
Inactive Wait Time
Metric Description
Inactive Wait Time is the time when a thread remains inactive and excluded from execution by the OS scheduler due to either synchronization or preemption. Significant Inactive Wait Time on the critical path of an application execution, combined with a poor CPU Utilization, negatively impacts application parallelism. Explore wait stacks to identify contended synchronization objects and apply optimization techniques to reduce the contention.
Inactive Wait Time with poor CPU Utilization
Metric Description
Inactive Wait Time is the time when a thread remains inactive and excluded from execution by the OS scheduler due to either synchronization or preemption. Significant Inactive Wait Time on the critical path of an application execution, combined with a poor CPU Utilization, negatively impacts application parallelism. Explore wait stacks to identify contended synchronization objects and apply optimization techniques to reduce the contention.
Incoming Bandwidth Bound
Metric Description
This metric represents a percentage of elapsed time the system spent with a high incoming bandwidth utilization of the Intel Omni-Path Fabric. Note that the metric is calculated towards theoretical maximum networking bandwidth and does not take into account dynamic network conditions such as link oversubscription that can reduce the theoretical maximum.
Possible Issues
High incoming network bandwidth utilization was detected. This may lead to increased communication time. You may use Intel Trace Analyzer and Collector for communication pattern analysis.
Incoming Packet Rate Bound
Metric Description
This metric represents a percentage of elapsed time the system spent with a high incoming packet rate of the Intel Omni-Path Fabric. Explore the Packet Rate Histogram to scale the issue.
Possible Issues
High incoming network packet rate was detected. This may lead to increased communication time. You may use Intel Trace Analyzer and Collector for communication pattern analysis.
Instruction Starvation
Metric Description
A large code working set size or a high degree of branch misprediction can induce instruction delivery stalls at the front-end, such as misses in the L1I. Such stalls are called Instruction Starvation. This metric is the ratio of cycles generated when no instruction was issued by the front-end to all cycles.
Possible Issues
A significant number of CPU cycles is spent waiting for code to be delivered due to L1I misses or other problems. Look for ways to reduce the code working set, branch misprediction, and the use of virtual functions.
Interrupt Time
I/O Wait Time
Metric Description
This metric represents a portion of time when threads reside in I/O wait state while there are idle cores on the system
IPC
Metric Description
Instructions Retired per Cycle, or IPC shows average number of retired instructions per cycle. Modern superscalar processors issue up to four instructions per cycle, suggesting a theoretical best IPC of 4. But various effects (long-latency memory, floating-point, or SIMD operations; non-retired instructions due to branch mispredictions; instruction starvation in the front-end) tend to pull the observed IPC down. A IPC of 1 is generally considered acceptable for HPC applications but different application domains will have very different expected values. Nonetheless, IPC is an excellent metric for judging an overall potential for application performance tuning.
Possible Issues
The IPC may be too low. This could be caused by issues such as memory stalls, instruction starvation, branch misprediction or long latency instructions. Explore the other hardware-related metrics to identify what is causing low IPC.
L1 Bound
Metric Description
This metric shows how often machine was stalled without missing the L1 data cache. The L1 cache typically has the shortest latency. However, in certain cases like loads blocked on older stores, a load might suffer a high latency even though it is being satisfied by the L1.
Possible Issues
This metric shows how often machine was stalled without missing the L1 data cache. The L1 cache typically has the shortest latency. However, in certain cases like loads blocked on older stores, a load might suffer a high latency even though it is being satisfied by the L1. Note that this metric value may be highlighted due to DTLB Overhead or Cycles of 1 Port Utilized issues.
4K Aliasing
Metric Description
This metric estimates how often memory load accesses were aliased by preceding stores (in the program order) with a 4K address offset. Possible false match may incur a few cycles to re-issue a load. However, a short re-issue duration is often hidden by the out-of-order core and HW optimizations. Hence, you may safely ignore a high value of this metric unless it propagates up into parent nodes of the hierarchy (for example, to L1_Bound).
Possible Issues
A significant proportion of cycles is spent dealing with false 4k aliasing between loads and stores.
Tips
Use the source/assembly view to identify the aliasing loads and stores, and then adjust your data layout so that the loads and stores no longer alias. See the Intel 64 and IA-32 Architectures Optimization Reference Manual for more details.
DTLB Overhead
Metric Description
In x86 architectures, mappings between virtual and physical memory are facilitated by a page table, which is kept in memory. To minimize references to this table, recently-used portions of the page table are cached in a hierarchy of 'translation look-aside buffers', or TLBs, which are consulted on every virtual address translation. As with data caches, the farther a request has to go to be satisfied, the worse the performance impact. This metric estimates the performance penalty paid for missing the first-level data TLB (DTLB) that includes hitting in the second-level data TLB (STLB) as well as performing a hardware page walk on an STLB miss.
Possible Issues
A significant proportion of cycles is being spent handling first-level data TLB misses.
Tips
1. As with ordinary data caching, focus on improving data locality and reducing the working-set size to minimize the DTLB overhead.
2. Consider using profile-guided optimization (PGO) to collocate frequently-used data on the same page.
3. Try using larger page sizes for large amounts of frequently-used data.
FB Full
Metric Description
This metric does a rough estimation of how often L1D Fill Buffer unavailability limited additional L1D miss memory access requests to proceed. The higher the metric value, the deeper the memory hierarchy level the misses are satisfied from. Often it hints on approaching bandwidth limits (to L2 cache, L3 cache or external memory).
Possible Issues
This metric does a rough estimation of how often L1D Fill Buffer unavailability limited additional L1D miss memory access requests to proceed. The higher the metric value, the deeper the memory hierarchy level the misses are satisfied from. Often it hints on approaching bandwidth limits (to L2 cache, L3 cache or external memory). Avoid adding software prefetches if indeed memory BW limited.
Loads Blocked by Store Forwarding
Metric Description
To streamline memory operations in the pipeline, a load can avoid waiting for memory if a prior store, still in flight, is writing the data that the load wants to read (a 'store forwarding' process). However, in some cases, generally when the prior store is writing a smaller region than the load is reading, the load is blocked for a signficant time pending the store forward. This metric measures the performance penalty of such blocked loads.
Possible Issues
Loads are blocked during store forwarding for a significant proportion of cycles.
Tips
Use source/assembly view to identify the blocked loads, then identify the problematically-forwarded stores, which will typically be within the ten dynamic instructions prior to the load. If the forwarding store is smaller than the load, change the store to be the same size as the load.
Lock Latency
Metric Description
This metric represents cycles fraction the CPU spent handling cache misses due to lock operations. Due to the microarchitecture handling of locks, they are classified as L1 Bound regardless of what memory source satisfied them.
Possible Issues
A significant fraction of CPU cycles spent handling cache misses due to lock operations. Due to the microarchitecture handling of locks, they are classified as L1 Bound regardless of what memory source satisfied them. Note that this metric value may be highlighted due to Store Latency issue.
Split Loads
Metric Description
Throughout the memory hierarchy, data moves at cache line granularity - 64 bytes per line. Although this is much larger than many common data types, such as integer, float, or double, unaligned values of these or other types may span two cache lines. Recent Intel architectures have significantly improved the performance of such 'split loads' by introducing split registers to handle these cases, but split loads can still be problematic, especially if many split loads in a row consume all available split registers.
Possible Issues
A significant proportion of cycles is spent handling split loads.
Tips
Consider aligning your data to the 64-byte cache line granularity. See the Intel 64 and IA-32 Architectures Optimization Reference Manual for more details.
L1 Hit Rate
Metric Description
The L1 cache is the first, and shortest-latency, level in the memory hierarchy. This metric provides the ratio of demand load requests that hit the L1 cache to the total number of demand load requests.
L1D Replacement Percentage
Metric Description
When a cache line is brought into the L1 cache, another line must be evicted to make room for it. When lines in active use are evicted, a performance problem may arise from continually rotating data back into the cache. This metric measures the percentage of all replacements due to each row. For example, if the grouping is set to 'Function', this metric shows the percentage of all replacements due to each function, summing up to 100%.
Possible Issues
This row is responsible for a majority of all L1 cache replacements. Some replacements are unavoidable, and a high level of replacements may not indicate a problem. Consider this metric only when looking for the source of a significant number of L1 cache misses for a particular grouping. If these replacements are marked as a problem, try rearranging data structures (for example, moving infrequently-used data away from more-frequently-used data so that unused data is not taking up cache space) or re-ordering operations (to get as much use as possible out of data before it is evicted).
L1D Replacements
Metric Description
Replacements into the L1D
L1I Stall Cycles
Metric Description
In a shared-memory machine, instructions and data are stored in the same memory address space. However, for performance, they are cached separately. Large code working set, branch misprediction, including one caused by excessive use of virtual functions, can induce misses into L1I and so cause instruction starvation that badly influence application performance.
Possible Issues
A significant number of CPU cycles is spent waiting for code to arrive into L1I. Review application code for the patterns causing instruction starvation and rearrange the code.
L2 Bound
Metric Description
This metric shows how often machine was stalled on L2 cache. Avoiding cache misses (L1 misses/L2 hits) will improve the latency and increase performance.
L2 Hit Bound
Metric Description
The L2 is the last and longest-latency level in the memory hierarchy before the main memory (DRAM) or MCDRAM. While L2 hits are serviced much more quickly than hits in DRAM or MCDRAM, they can still incur a significant performance penalty. This metric also includes coherence penalties for shared data. The L2 Hit Bound metric shows a ratio of cycles spent handling L2 hits to all cycles. The cycles spent handling L2 hits are calculated as L2 CACHE HIT COST * L2 CACHE HIT COUNT where L2 CACHE HIT COST is a constant measured as typical L2 access latency in cycles.
Possible Issues
A significant proportion of cycles is being spent on data fetches that miss the L1 but hit the L2. This metric includes coherence penalties for shared data.
Tips
1. If contested accesses or data sharing are indicated as likely issues, address them first. Otherwise, consider the performance tuning applicable to an L2-missing workload: reduce the data working set size, improve data access locality, consider blocking or partitioning your working set so that it fits into the L1, or better exploit hardware prefetchers.
2. Consider using software prefetchers, but note that they can interfere with normal loads, potentially increasing latency, as well as increase pressure on the memory system.
L2 Hit Rate
Metric Description
The L2 is the last and longest-latency level in the memory hierarchy before DRAM or MCDRAM. While L2 hits are serviced much more quickly than hits in DRAM or MCDRAM, they can still incur a significant performance penalty. This metric provides a ratio of the demand load requests that hit the L2 to the total number of the demand load requests serviced by the L2. This metric does not include instruction fetches.
Possible Issues
The L2 is the last and longest-latency level in the memory hierarchy before DRAM or MCDRAM. While L2 hits are serviced much more quickly than hits in DRAM, they can still incur a significant performance penalty. This metric provides the ratio of demand load requests that hit the L2 to the total number of the demand load requests serviced by the L2. This metric does not include instruction fetches.
L2 HW Prefetcher Allocations
Metric Description
The number of L2 allocations caused by HW Prefetcher.
L2 Input Requests
Metric Description
A total number of L2 allocations. This metric accounts for both demand loads and HW prefetcher requests.
L2 Miss Bound
Metric Description
The L2 is the last and longest-latency level in the memory hierarchy before the main memory (DRAM) or MCDRAM. Any memory requests missing here must be serviced by local or remote DRAM or MCDRAM, with significant latency. The L2 Miss Bound metric shows a ratio of cycles spent handling L2 misses to all cycles. The cycles spent handling L2 misses are calculated as L2 CACHE MISS COST * L2 CACHE MISS COUNT where L2 CACHE MISS COST is a constant measured as typical DRAM access latency in cycles.
Possible Issues
A high number of CPU cycles is being spent waiting for L2 load misses to be serviced.
Tips
1. Reduce the data working set size, improve data access locality, blocking and consuming data in chunks that fit into the L2, or better exploit hardware prefetchers.
2. Consider using software prefetchers but note that they can increase latency by interfering with normal loads, as well as increase pressure on the memory system.
L2 Miss Count
Metric Description
The L2 is the last and longest-latency level in the memory hierarchy before the main memory (DRAM) or MCDRAM. Any memory requests missing here must be serviced by local or remote DRAM or MCDRAM, with significant latency. The L2 Miss Count metric shows the total number of demand loads that missed the L2. Misses due to the HW prefetcher are not included.
L2 Replacement Percentage
Metric Description
When a cache line is brought into the L2 cache, another line must be evicted to make room for it. When lines in active use are evicted, a performance problem may arise from continually rotating data back into the cache. This metric measures the percentage of all replacements due to each row. For example, if the grouping is set to 'Function', this metric shows the percentage of all replacements due to each function, summing up to 100%.
Possible Issues
This row is responsible for a majority of all L2 cache replacements. Some replacements are unavoidable, and a high level of replacements may not indicate a problem. Consider this metric only when looking for the source of a significant number of L2 cache misses for a particular grouping. If these replacements are marked as a problem, try rearranging data structures (for example, moving infrequently-used data away from more-frequently-used data so that unused data is not taking up cache space) or re-ordering operations (to get as much use as possible out of data before it is evicted).
L2 Replacements
Metric Description
Replacements into the L2
L3 Bound
Metric Description
This metric shows how often CPU was stalled on L3 cache, or contended with a sibling Core. Avoiding cache misses (L2 misses/L3 hits) improves the latency and increases performance.
Contested Accesses
Metric Description
Contested accesses occur when data written by one thread is read by another thread on a different core. Examples of contested accesses include synchronizations such as locks, true data sharing such as modified locked variables, and false sharing. This metric is a ratio of cycles generated while the caching system was handling contested accesses to all cycles.
Possible Issues
There is a high number of contested accesses to cachelines modified by another core. Consider either using techniques suggested for other long latency load events (for example, LLC Miss) or reducing the contested accesses. To reduce contested accesses, first identify the cause. If it is synchronization, try increasing synchronization granularity. If it is true data sharing, consider data privatization and reduction. If it is false data sharing, restructure the data to place contested variables in distinct cachelines. This may increase the working set due to padding, but false sharing can always be avoided.
Data Sharing
Metric Description
Data shared by multiple threads (even just read shared) may cause increased access latency due to cache coherency. This metric measures the impact of that coherency. Excessive data sharing can drastically harm multithreaded performance. This metric is defined by the ratio of cycles while the caching system is handling shared data to all cycles. It does not measure waits due to contention on a variable, which is measured by the analysis.
Possible Issues
Significant data sharing by different cores is detected.
Tips
1. Examine the Contested Accesses metric to determine whether the major component of data sharing is due to contested accesses or simple read sharing. Read sharing is a lower priority than Contested Accesses or issues such as LLC Misses and Remote Accesses.
2. If simple read sharing is a performance bottleneck, consider changing data layout across threads or rearranging computation. However, this type of tuning may not be straightforward and could bring more serious performance issues back.
L3 Latency
Metric Description
This metric shows a fraction of cycles with demand load accesses that hit the L3 cache under unloaded scenarios (possibly L3 latency limited). Avoiding private cache misses (i.e. L2 misses/L3 hits) will improve the latency, reduce contention with sibling physical cores and increase performance. Note the value of this node may overlap with its siblings.
LLC Hit
Metric Description
The LLC (last-level cache) is the last, and longest-latency, level in the memory hierarchy before main memory (DRAM). While LLC hits are serviced much more quickly than hits in DRAM, they can still incur a significant performance penalty. This metric also includes coherence penalties for shared data.
Possible Issues
A significant proportion of cycles is being spent on data fetches that miss in the L2 but hit in the LLC. This metric includes coherence penalties for shared data.
Tips
1. If contested accesses or data sharing are indicated as likely issues, address them first. Otherwise, consider the performance tuning applicable to an LLC-missing workload: reduce the data working set size, improve data access locality, consider blocking or partitioning your working set so that it fits into the low-level cache, or better exploit hardware prefetchers.
2. Consider using software prefetchers, but note that they can interfere with normal loads, potentially increasing latency, as well as increase pressure on the memory system.
SQ Full
Metric Description
This metric measures fraction of cycles where the Super Queue (SQ) was full taking into account all request-types and both hardware SMT threads. The Super Queue is used for requests to access the L2 cache or to go out to the Uncore.
LLC Load Misses Serviced By Remote DRAM
Metric Description
In NUMA (non-uniform memory architecture) machines, memory requests missing in LLC may be serviced either by local or remote DRAM. Memory requests to remote DRAM incur much greater latencies than those to local DRAM. It is recommended to keep as much frequently accessed data local as possible. This metric is defined by the ratio of cycles when LLC load misses are serviced by remote DRAM to all cycles.
Possible Issues
A significant amount of time is spent servicing memory requests from remote DRAM. Wherever possible, try to consistently use data on the same core, or at least the same package, as it was allocated on.
LLC Miss Count
Metric Description
The LLC (last-level cache) is the last, and longest-latency, level in the memory hierarchy before main memory (DRAM). Any memory requests missing here must be serviced by local or remote DRAM, with significant latency. The LLC Miss Count metric shows total number of demand loads which missed LLC. Misses due to HW prefetcher are not included.
LLC Replacement Percentage
Metric Description
When a cache line is brought into the last-level cache, another line must be evicted to make room for it. When lines in active use are evicted, a performance problem may arise from continually rotating data back into the cache. This metric measures the percentage of all replacements due to each row. For example, if the grouping is set to 'Function', this metric shows the percentage of all replacements due to each function, summing up to 100%.
Possible Issues
This row is responsible for a majority of all last-level cache replacements. Some replacements are unavoidable, and a high level of replacements may not indicate a problem. Consider this metric only when looking for the source of a significant number of last-level cache misses for a particular grouping. If these replacements are marked as a problem, try rearranging data structures (for example, moving infrequently-used data away from more-frequently-used data so that unused data is not taking up cache space) or re-ordering operations (to get as much use as possible out of data before it is evicted).
LLC Replacements
Metric Description
Replacements into the LLC
Local DRAM Access Count
Metric Description
This metric shows the total number of LLC misses serviced by the local memory. Misses due to HW prefetcher are not included.
Logical Core Utilization
Metric Description
This metric represents how efficiently the application utilized the CPUs available and helps evaluate the parallel efficiency of the application. It shows the percent of average CPU utilization by all logical CPUs on the system.
Loop Entry Count
Metric Description
Statistical estimation of the number of times the loop was entered from the outside. Values of this metric are not aggregated per call stack filter mode.
(Info) LSD Coverage
Metric Description
This metric shows a fraction of uOps delivered by the LSD (Loop Stream Detector or Loop Cache).
Machine Clears
Metric Description
Certain events require the entire pipeline to be cleared and restarted from just after the last retired instruction. This metric measures three such events: memory ordering violations, self-modifying code, and certain loads to illegal address ranges. Machine Clears metric represents slots fraction the CPU has wasted due to Machine Clears. These slots are either wasted by uOps fetched prior to the clear, or stalls the out-of-order portion of the machine needs to recover its state after the clear.
Possible Issues
A significant portion of execution time is spent handling machine clears.
Tips
Examine the MACHINE_CLEARS events to determine the specific cause. See the "Memory Disambiguation" section in the Intel 64 and IA-32 Architectures Optimization Reference Manual for more details.
Max DRAM Single-Package Bandwidth
Metric Description
Maximum DRAM bandwidth for single package measured by running a micro-benchmark before the collection starts. If the system has already been actively loaded at the moment of collection start (for example, with the attach mode), the value may be less accurate.
Max DRAM System Bandwidth
Metric Description
Maximum DRAM bandwidth measured for the whole system (across all packages) by running a micro-benchmark before the collection starts. If the system has already been actively loaded at the moment of collection start (for example, with the attach mode), the value may be less accurate.
MCDRAM Bandwidth Bound
Metric Description
This metric represents percentage of elapsed time the system spent with high MCDRAM bandwidth utilization. Review the Bandwidth Utilization Histogram to estimate the scale of the issue.
Possible Issues
The system spent a significant percentage of elapsed time with high MCDRAM bandwidth utilization. Review the Bandwidth Utilization Histogram to estimate the scale of the issue. Consider improving data locality and L1/L2 cache reuse.
MCDRAM Cache Bandwidth Bound
Metric Description
This metric represents percentage of elapsed time the system spent with high MCDRAM Cache bandwidth utilization. Review the Bandwidth Utilization Histogram to estimate the scale of the issue.
Possible Issues
The system spent a significant percentage of elapsed time with high MCDRAM Cache bandwidth utilization. Review the Bandwidth Utilization Histogram to estimate the scale of the issue. Consider improving data locality and L1/L2 cache reuse.
MCDRAM Flat Bandwidth Bound
Metric Description
This metric represents percentage of elapsed time the system spent with high MCDRAM Flat bandwidth utilization. Review the Bandwidth Utilization Histogram to estimate the scale of the issue.
Possible Issues
The system spent a significant percentage of elapsed time with high MCDRAM Flat bandwidth utilization. Review the Bandwidth Utilization Histogram to estimate the scale of the issue. Consider improving data locality and/or merging compute-intensive code with bandiwdth-intensive code.
Memory Bandwidth
Metric Description
This metric represents a fraction of cycles during which an application could be stalled due to approaching bandwidth limits of the main memory (DRAM). This metric does not aggregate requests from other threads/cores/sockets (see Uncore counters for that). Consider improving data locality in NUMA multi-socket systems.
Possible Issues
A significant fraction of cycles were stalled due to to approaching bandwidth limits of the main memory (DRAM).
Tips
Improve data accesses to reduce cacheline transfers from/to memory using these possible techniques:
Consume all bytes of each cacheline before it is evicted (for example, reorder structure elements and split non-hot ones).
Merge compute-limited and bandwidth-limited loops.
Use NUMA optimizations on a multi-socket system.
Software prefetches do not help a bandwidth-limited application.
Memory Bound
Metric Description
This metric shows how memory subsystem issues affect the performance. Memory Bound measures a fraction of slots where pipeline could be stalled due to demand load or store instructions. This accounts mainly for incomplete in-flight memory demand loads that coincide with execution starvation in addition to less common cases where stores could imply back-pressure on the pipeline.
Possible Issues
The metric value is high. This can indicate that the significant fraction of execution pipeline slots could be stalled due to demand memory load and stores. Use Memory Access analysis to have the metric breakdown by memory hierarchy, memory bandwidth information, correlation by memory objects.
DRAM Bound
Metric Description
This metric shows how often CPU was stalled on the main memory (DRAM). Caching typically improves the latency and increases performance.
DRAM Bandwidth Bound
Metric Description
This metric represents percentage of elapsed time the system spent with high DRAM bandwidth utilization. Since this metric relies on the accurate peak system DRAM bandwidth measurement, explore the Bandwidth Utilization Histogram and make sure the Low/Medium/High utilization thresholds are correct for your system. You can manually adjust them, if required.
Possible Issues
The system spent much time heavily utilizing DRAM bandwidth. Improve data accesses to reduce cacheline transfers from/to memory using these possible techniques: 1) consume all bytes of each cacheline before it is evicted (for example, reorder structure elements and split non-hot ones); 2) merge compute-limited and bandwidth-limited loops; 3) use NUMA optimizations on a multi-socket system. Note: software prefetches do not help a bandwidth-limited application. Run Memory Access analysis to identify data structures to be allocated in High Bandwidth Memory (HBM), if available.
UPI Utilization Bound
Metric Description
This metric represents percentage of elapsed time the system spent with high UPI utilization. Explore the Bandwidth Utilization Histogram and make sure the Low/Medium/High utilization thresholds are correct for your system. You can manually adjust them, if required.
The UPI Utilization metric replaced QPI Utilization starting with systems based on Intel® microarchitecture code name Skylake.
Possible Issues
The system spent much time heavily utilizing UPI bandwidth. Improve data accesses using NUMA optimizations on a multi-socket system.
Memory Latency
Metric Description
This metric represents a fraction of cycles during which an application could be stalled due to the latency of the main memory (DRAM). This metric does not aggregate requests from other threads/cores/sockets (see Uncore counters for that). Consider optimizing data layout or using Software Prefetches (through the compiler).
Possible Issues
This metric represents a fraction of cycles during which an application could be stalled due to the latency of the main memory (DRAM).
Tips
Improve data accesses or interleave them with compute using such possible techniques as data layout re-structuring or software prefetches (through the compiler).
Local DRAM
Metric Description
This metric shows how often CPU was stalled on loads from local memory. Caching will improve the latency and increase performance.
Possible Issues
The number of CPU stalls on loads from the local memory exceeds the threshold. Consider caching data to improve the latency and increase the performance.
Remote Cache
Metric Description
This metric shows how often CPU was stalled on loads from remote cache in other sockets. This is caused often due to non-optimal NUMA allocations.
Possible Issues
The number of CPU stalls on loads from the remote cache exceeds the threshold. This is often caused by non-optimal NUMA memory allocations.
Remote DRAM
Metric Description
This metric shows how often CPU was stalled on loads from remote memory. This is caused often due to non-optimal NUMA allocations.
Possible Issues
The number of CPU stalls on loads from the remote memory exceeds the threshold. This is often caused by non-optimal NUMA memory allocations.
NUMA: % of Remote Accesses
Metric Description
In Non-uniform Memory Architecture (NUMA) machines, memory requests without LLC may be serviced by local or remote DRAM. Memory requests to remote DRAM incur much greater latencies than requests to local DRAM. This metric shows the percentage of remote accesses. As far as possible, keep this metric low and frequently accessed data local. This metric does not take into account memory accesses serviced by remote cache.
Possible Issues
A significant amount of DRAM loads were serviced from remote DRAM. Wherever possible, try to consistently use data on the same core, or at least the same package, as it was allocated on.
Memory Efficiency
Metric Description
This metric represents how efficiently the memory subsystem was used by the application. It shows the percent of cycles where the pipeline was not stalled due to demand load or store instructions. The metric is based on the Memory Bound measurement.
Microarchitecture Usage
Metric Description
Microarchitecture Usage metric is a key indicator that helps estimate (in %) how effectively your code runs on the current microarchitecture. Microarchitecture Usage can be impacted by long-latency memory, floating-point, or SIMD operations; non-retired instructions due to branch mispredictions; instruction starvation in the front-end.
Possible Issues
You code efficiency on this platform is too low.
Possible cause: memory stalls, instruction starvation, branch misprediction or long latency instructions.
Tips
Run Microarchitecture Exploration analysis to identify the cause of the low microarchitecture usage efficiency.
Microcode Sequencer
Metric Description
This metric represents a fraction of slots during which CPU was retiring uOps fetched by the Microcode Sequencer (MS) ROM. The MS is used for CISC instructions not fully decoded by the default decoders (like repeat move strings), or by microcode assists used to address some modes of operation (like in Floating-Point assists).
Possible Issues
A significant fraction of cycles was spent retiring uOps fetched by the Microcode Sequencer.
Tips
1. Make sure the /arch compiler flags are correct.
2. Check the child Assists metric and, if it is highlighted as an issue, follow the provided recommendations.
Note that this metric value may be highlighted due to MS Switches issue.
Mispredicts Resteers
Metric Description
This metric measures the fraction of cycles the CPU was stalled due to Branch Resteers as a result of Branch Misprediction at execution stage.
Possible Issues
A significant fraction of cycles could be stalled due to Branch Resteers as a result of Branch Misprediction at execution stage.
MO Machine Clear Overhead
Metric Description
Certain events require the entire pipeline to be cleared and restarted from just after the last retired instruction. This metric estimates the overhead of machine clears due to Memory Ordering. The memory ordering (MO) machine clear happens when a snoop request from another processor matches a source for a data operation in the pipeline. In this situation the pipeline is cleared before the loads and stores in progress are retired. Then the pipeline is restarted from the previous retired instruction, ensuring that memory ordering of loads and stores can be preserved, both within one core and across cores. Memory ordering issues cause a severe penalty in all processors based on Intel architecture.
Possible Issues
A significant portion of execution time is spent clearing the machine to handle memory ordering requirements. To avoid this, reorder your load and store instructions, particularly loads and stores of data that is shared, or reduce sharing requirements.
MPI Imbalance
Metric Description
MPI Imbalance shows the CPU time spent by ranks spinning in waits on communication operations, normalized by the number of ranks. High metric value can be caused by application workload imbalance between ranks, nonoptimal communication schema or settings of MPI library. Explore details on communication inefficiencies with Intel Trace Analyzer and Collector.
MPI Rank on the Critical Path
Metric Description
The section contains metrics for the rank with minimum MPI Busy Wait time that is on the critical path of application execution on this node. Consider exploring CPU utilization efficiency for this rank.
MS Entry
Metric Description
This metric estimates a fraction of cycles lost due to the Microcode Sequencer entry.
Possible Issues
A significant number of CPU cycles lost due to the Microcode Sequencer entry.
MUX Reliability
Metric Description
This metric estimates reliability of HW event-related metrics. Since the number of collected HW events exceeds the number of counters, Intel® VTune™ Profiler uses event multiplexing (MUX) to share HW counters and collect different subsets of events over time. This may affect the precision of collected event data. The ideal value for this metric is 1. If the value is less than 0.7, the collected data may be not reliable.
Possible Issues
Precision of collected HW event data is not enough. Metrics data may be unreliable. Consider increasing your application execution time, using the multiple runs mode instead of event multiplexing, or creating a custom analysis with a limited subset of HW events. If you are using a driverless collection, consider reducing the value of /sys/bys/event_source/devices/cpu/perf_event_mux_interval_ms file.
A high value for this metric does not guarantee an accuracy of the hardware-based metrics. However, a low value definitely puts the metrics in question and you should re-run the analysis using the Allow multiple runs option or increase the execution time to improve the accuracy.
OpenMP* Analysis. Collection Time
Metric Description
Collection Time is wall time from the beginning to the end of collection, excluding Paused Time.
OpenMP Region Time
Metric Description
OpenMP Region Time is a duration of all the lexical region instances.
Other
Metric Description
This metric represents a non-floating-point (FP) uop fraction the CPU has executed. If your application has no FP operations, this is likely to be the biggest fraction.
Outgoing Bandwidth Bound
Metric Description
This metric represents a percentage of elapsed time the system spent with a high outgoing bandwidth utilization of the Intel Omni-Path Fabric. Note that the metric is calculated towards theoretical maximum networking bandwidth and does not take into account dynamic network conditions such as link oversubscription that can reduce the theoretical maximum.
Possible Issues
High outgoing network bandwidth utilization was detected. This may lead to increased communication time. You may use Intel Trace Analyzer and Collector for communication pattern analysis.
Outgoing Packet Rate Bound
Metric Description
This metric represents a percentage of elapsed time the system spent with high Intel Omni-Path Fabric outgoing packet rate. Explore the Packet Rate Histogram to scale the issue.
Possible Issues
High outgoing network packet rate was detected. This may lead to increased communication time. You may use Intel Trace Analyzer and Collector for communication pattern analysis.
Overhead Time
Metric Description
Overhead time is CPU time spent on the overhead of known synchronization and threading libraries, such as system synchronization APIs, Intel® oneAPI Threading Building Blocks(oneTBB ), and OpenMP.
Possible Issues
A significant portion of CPU time is spent in synchronization or threading overhead. Consider increasing task granularity or the scope of data synchronization.
Page Walk
Metric Description
In x86 architectures, mappings between virtual and physical memory are facilitated by a page table that is kept in memory. To minimize references to this table, recently-used portions of the page table are cached in a hierarchy of 'translation look-aside buffers', or TLBs, which are consulted on every virtual address translation. As with data caches, the farther a request has to go to be satisfied, the worse the performance impact is. This metric estimates the performance penalty paid for missing the first-level TLB that includes hitting in the second-level data TLB (STLB) as well as performing a hardware page walk on an STLB miss.
Possible Issues
Page Walks have a large performance penalty because they involve accessing the contents of multiple memory locations to calculate the physical address. Since this metric includes the cycles handling both instruction and data TLB misses, look at ITLB Overhead and DTLB Overhead and follow the instructions to improve performance. Also examine PAGE_WALKS.D_SIDE_CYCLES and PAGE_WALKS.I_SIDE_CYCLES events in the source/assembly view for further breakdown. Account for skid.
Parallel Region Time
Metric Description
Parallel Region Time is the total duration for all instances of all lexical parallel regions. Percent value is based on Collection Time.
Paused Time
Metric Description
Paused time is the amount of Elapsed time during which the analysis was paused using either the GUI, CLI commands, or user API.
Persistent Memory Bound
Metric Description
This metric estimates how frequently the CPU was stalled on accesses to external Intel Optane DC Persistent Memory by loads. This metric is defined on machines with Intel Optane DC Persistent Memory App Direct Mode.
Pipeline Slots
Metric Description
A pipeline slot represents hardware resources needed to process one uOp.
The Top-Down Characterization assumes that for each CPU core, on each clock cycle, there are several pipeline slots available. This number is called Pipeline Width.
OpenMP* Potential Gain
Metric Description
Potential Gain shows the maximum time that could be saved if the OpenMP region is optimized to have no load imbalance assuming no runtime overhead (Parallel Region Time minus Region Ideal Time). If the Potential Gain is large, make sure the workload for this region is enough and the loop schedule is optimal.
VTune Profiler uses the following methodology to calculate the Potential Gain metric that is a sum of inefficiencies normalized by the number of threads:
Possible Issues
The time wasted on load imbalance or parallel work arrangement is significant and negatively impacts the application performance and scalability. Explore OpenMP regions with the highest metric values. Make sure the workload of the regions is enough and the loop schedule is optimal.
Imbalance
Metric Description
OpenMP Potential Gain Imbalance shows maximum elapsed time that could be saved if the OpenMP construct is optimized to have no imbalance. It is calculated as summary of CPU time by all OpenMP threads spinning on a barrier divided by the number of OpenMP threads.
Possible Issues
Significant time spent waiting on an OpenMP barrier inside of a parallel region can be a result of load imbalance. Consider using dynamic work scheduling to reduce the imbalance, where possible.
Lock Contention
Metric Description
OpenMP Potential Gain Lock Contention shows elapsed time cost of OpenMP locks and ordered synchronization. High metric value may signal inefficient parallelization with highly contended synchronization objects. To avoid intensive synchronization, consider using reduction, atomic operations or thread local variables where possible. This metric is based on CPU sampling and does not include passive waits.
Possible Issues
When synchronization objects are used inside a parallel region, threads can spend CPU time waiting on a lock release, contending with other threads for a shared resource. Where possible, reduce synchronization by using reduction or atomic operations, or minimize the amount of code executed inside the critical section.
Pre-Decode Wrong
Metric Description
This metric estimates a fraction of cycles lost due to the decoder predicting wrong instruction length.
Possible Issues
A significant number of CPU cycles lost due to the decoder predicting wrong instruction length.
Remote Cache Access Count
Metric Description
This metric shows the total number of LLC misses serviced by the remote cache in other sockets. Misses due to HW prefetcher are not included.
Remote DRAM Access Count
Metric Description
This metric shows the total number of LLC misses serviced by the remote memory. Misses due to HW prefetcher are not included.
Remote / Local DRAM Ratio
Metric Description
In NUMA (non-uniform memory architecture) machines, memory requests missing LLC may be serviced either by local or remote DRAM. Memory requests to remote DRAM incur much greater latencies than those to local DRAM. It is recommended to keep as much frequently accessed data local as possible. This metric is defined by the ratio of remote DRAM loads to local DRAM loads.
Possible Issues
A significant amount of DRAM loads were serviced from remote DRAM. Wherever possible, try to consistently use data on the same core, or at least the same package, as it was allocated on.
Retire Stalls
Metric Description
This metric is defined as a ratio of the number of cycles when no micro-operations are retired to all cycles. In the absence of performance issues, long latency operations, and dependency chains, retire stalls are insignificant. Otherwise, retire stalls result in a performance penalty.
Possible Issues
A high number of retire stalls is detected. This may result from branch misprediction, instruction starvation, long latency operations, and other issues. Use this metric to find where you have stalled instructions. Once you have located the problem, analyze metrics such as LLC Miss, Execution Stalls, Remote Accesses, Data Sharing, and Contested Accesses, or look for long-latency instructions like divisions and string operations to understand the cause.
Retiring
Metric Description
Retiring metric represents a Pipeline Slots fraction utilized by useful work, meaning the issued uOps that eventually get retired. Ideally, all Pipeline Slots would be attributed to the Retiring category. Retiring of 100% would indicate the maximum possible number of uOps retired per cycle has been achieved. Maximizing Retiring typically increases the Instruction-Per-Cycle metric. Note that a high Retiring value does not necessary mean no more room for performance improvement. For example, Microcode assists are categorized under Retiring. They hurt performance and can often be avoided.
Possible Issues
A high fraction of pipeline slots was utilized by useful work.
Tips
While the goal is to make this metric value as big as possible, a high Retiring value for non-vectorized code could prompt you to consider code vectorization. Vectorization enables doing more computations without significantly increasing the number of instructions, thus improving the performance. Note that this metric value may be highlighted due to Microcode Sequencer (MS) issue, so the performance can be improved by avoiding using the MS.
Self Time and Total Time
Self Time
Self time is the time spent in a particular program unit. For example, Self time for a source line shows the time the application spent at this particular source line. Self time can help you understand the impact that a function has on the program. Investigating the impact of single functions is also known as bottom-up analysis.
For example, in a single-threaded program with negligible Wait time, the Self time for the function foo() is 10% of the program CPU time. If you optimize foo() so that it is twice as fast, the Elapsed time for the program improves by 5%.
The impact of Self time on the Elapsed time of a parallel application depends on the utilization of different threads. Reducing the time that a given function runs to zero may have no impact on the Elapsed time of the application
Total Time
Total time is the accumulated time that a program unit incurs. For functions, Total time includes Self time of the function itself and Self time of all functions that were called from that function. Total time enables a high-level understanding of how time is spent in the application. Investigating the impact of functions together with their callees is also known as top-down analysis.
Serial CPU Time
Metric Description
Serial CPU Time is the CPU time (compare with Serial Time outside parallel regions) spent by the application outside any OpenMP region in the master thread during collection. It directly impacts application Collection Time and scaling. High values signal a performance problem to be solved via code parallelization or algorithm tuning.
MPI Busy Wait Time
Metric Description
MPI Busy Wait Time is CPU time when MPI runtime library is spinning on waits in communication operations. High metric value can be caused by load imbalance between ranks, active communications or nonoptimal settings of MPI library. Explore details on communication inefficiencies with Intel® Trace Analyzer and Collector.
Possible Issues
CPU time spent on waits for MPI communication operations is significant and can negatively impact the application performance and scalability. This can be caused by load imbalance between ranks, active communications or non-optimal settings of MPI library. Explore details on communication inefficiencies with Intel Trace Analyzer and Collector.
Serial Time (outside parallel regions)
Metric Description
Serial Time is the time spent by the application outside any OpenMP region in the master thread during collection. It directly impacts application Collection Time and scaling. High values signal a performance problem to be solved via code parallelization or algorithm tuning.
Possible Issues
Serial Time of your application is high. It directly impacts application Elapsed Time and scalability. Explore options for parallelization, algorithm or microarchitecture tuning of the serial part of the application.
SIMD Assists
Metric Description
SIMD assists are invoked when an EMMS instruction is executed after MMX technology code has changed the MMX state in the floating point stack. The EMMS instruction clears the MMX technology state at the end of all MMX technology procedures or subroutines and before calling other procedures or subroutines that may execute x87 floating-point instructions, which can incur a performance penalty when intermixing MMX and X87 instructions. The SIMD assists are required in the streaming SIMD Extensions (SSE) instructions with denormal input when the DAZ (Denormals Are Zeros) flag is off or underflow result when the FTZ (Flush To Zero) flag is off.
Possible Issues
A significant portion of execution time is spent in SIMD assists. Consider enabling the DAZ (Denormals Are Zero) and/or FTZ (Flush To Zero) options in your compiler to flush denormals to zero. This option may improve performance if the denormal values are not critical in your application. Also note that the DAZ and FTZ modes are not compatible with the IEEE Standard 754.
SIMD Compute-to-L1 Access Ratio
Metric Description
This metric provides the ratio of SIMD compute instructions to the total number of memory loads, each of which will first access the L1 cache. On this platform, it is important that this ratio is large to ensure efficient usage of compute resources.
SIMD Compute-to-L2 Access Ratio
Metric Description
This metric provides the ratio of SIMD compute instructions to the total number of memory loads that hit the L2 cache. On this platform, it is important that this ratio is large to ensure efficient usage of compute resources.
SIMD Instructions per Cycle
Metric Description
This metric represents how intensively your program uses the FPU. 100% means that the FPU is fully loaded and is retiring a vector instruction with full capacity every cycle of the application execution.
Slow LEA Stalls
Metric Description
Some Load Effective Address (LEA) instructions (like three-operand LEA instructions) have increased latency and reduced dispatch port choices. The Slow LEA Stalls metric estimates the performance penalty of such slow LEAs.
Possible Issues
A significant proportion of cycles were spent handling slow LEA operations. Use the source view to discover the responsible instructions and try to avoid their use.
SMC Machine Clear
Metric Description
Certain events require the entire pipeline to be cleared and restarted from just after the last retired instruction. This metric measures only self-modifying code (SMC) events. This event counts the number of times a program writes to a code section that is shared with another processor or itself as a data page, causing the entire pipeline and the trace caches to be cleared. Self-modifying code causes a severe penalty in all processors based on Intel architecture.
Possible Issues
A significant portion of execution time is spent handling machine clears incurred by self-modifying code event. Dynamically-modified code (for example, target fix-ups) is likely to suffer from performance degradation due to SMC. To avoid this, introduce indirect branches and use data tables on data pages (not code pages) with register-indirect calls.
SP FLOPs per Cycle
Metric Description
Number of single precision floating point operations (FLOPs) per clocktick. This metric shows the efficiency of both vector code generation and execution. Explore the list of generated issues on the metric to see the reasons behind the low FLOP numbers. The maximum number of FLOPs per cycle depends on your hardware platform. All double operations are converted to two single operations.
SP GFLOPS
Metric Description
Number of single precision giga-floating point operations calculated per second. All double operations are converted to two single operations.
Spin Time
Metric Description
Spin time is Wait Time during which the CPU is busy. This often occurs when a synchronization API causes the CPU to poll while the software thread is waiting. Some Spin Time may be preferable to the alternative of increased thread context switches. Too much Spin Time, however, can reflect lost opportunity for productive work.
Possible Issues
A significant portion of CPU time is spent waiting. Use this metric to discover which synchronizations are spinning. Consider adjusting spin wait parameters, changing the lock implementation (for example, by backing off then descheduling), or adjusting the synchronization granularity.
Communication (MPI)
Metric Description
MPI Busy Wait Time is CPU time when MPI runtime library is spinning on waits in communication operations. High metric value can be caused by load imbalance between ranks, active communications or nonoptimal settings of MPI library. Explore details on communication inefficiencies with Intel Trace Analyzer and Collector.
Possible Issues
CPU time spent on waits for MPI communication operations is significant and can negatively impact the application performance and scalability. This can be caused by load imbalance between ranks, active communications or non-optimal settings of MPI library. Explore details on communication inefficiencies with Intel Trace Analyzer and Collector.
Imbalance or Serial Spinning
Metric Description
Imbalance or Serial Spinning time is CPU time when working threads are spinning on a synchronization barrier consuming CPU resources. This can be caused by load imbalance, insufficient concurrency for all working threads or waits on a barrier in the case of serialized execution.
Possible Issues
The threading runtime function related to time spent on imbalance or serial spinning consumed a significant amount of CPU time. This can be caused by a load imbalance, insufficient concurrency for all working threads, or busy waits of worker threads while serial code is executed. If there is an imbalance, apply dynamic work scheduling or reduce the size of work chunks or tasks. If there is insufficient concurrency, consider collapsing the outer and inner loops. If there is a wait for completion of serial code, explore options for parallelization with Intel Advisor, algorithm, or microarchitecture tuning of the application's serial code with VTune Profiler Hotspots or Microarchitecture Exploration analysis respectively. For OpenMP* applications, use the Per-Barrier OpenMP Potential Gain metric set in the HPC Performance Characterization analysis to discover the reason for high imbalance or serial spin time.
Lock Contention
Metric Description
Lock Contention time is CPU time when working threads are spinning on a lock consuming CPU resources. High metric value may signal inefficient parallelization with highly contended synchronization objects. To avoid intensive synchronization, consider using reduction, atomic operations or thread local variables where possible.
Possible Issues
When synchronization objects are used inside a parallel region, threads can spend CPU time waiting on a lock release, contending with other threads for a shared resource. Where possible, reduce synchronization by using reduction or atomic operations, or minimize the amount of code executed inside the critical section.
Other (Spin)
Metric Description
This metric shows unclassified Spin time spent in a threading runtime library.
Spin and Overhead Time
Overhead Time
Overhead time is the time the system takes to deliver a shared resource from a releasing owner to an acquiring owner. Ideally, the Overhead time should be close to zero because it means the resource is not being wasted through idleness. However, not all CPU time in a parallel application may be spent on doing real payload work. In cases when a parallel runtime (for example, Intel® Threading Building Blocks, Intel® Cilk™, OpenMP*) is used inefficiently, a significant portion of time may be spent inside the parallel runtime wasting CPU time at high concurrency levels. For example, if you increase the number of threads performing some fixed load of work in parallel, each thread gets less work and the overhead, as a relative measure, will get larger. It is a basic application of Amdahl's Law.
To detect this wasted CPU time, Intel® VTune™ Profiler analyzes the call stack at the point of interest and computes the Overhead time performance metric. VTune Profiler classifies the stack layers into user, system, and overhead layers and attributes the CPU time spent in system functions called by overhead functions to the overhead functions.
Spin Time
Spin time is the Wait time during which the CPU is busy. This often occurs when a synchronization API causes the CPU to poll while the software thread is waiting. Some Spin time may be preferable to the alternative of increased thread context switches. Too much Spin time, however, can reflect lost opportunity for productive work.
Overhead and Spin Time
VTune Profiler provides the combined Overhead and Spin Time metric in the grid and Timeline view of the Hotspots by CPU Utilization, Hotspots by Thread Concurrency, and Hotspots viewpoints. This metric represents the sum of the Overhead and Spin time values calculated as CPU Time where Call Site Type is Overhead + CPU Time where Call Site Type is Synchronization. To view the Overhead and Spin time values separately, expand the column by clicking the  symbol.
VTune Profiler ignores the Overhead and Spin time when calculating the CPU Utilization metric.
Possible Issues
A significant portion of CPU time is spent in synchronization or threading overhead. Consider increasing task granularity or the scope of data synchronization.
Atomics
Metric Description
Atomics time is CPU time that a runtime library spends on atomic operations.
Possible Issues
CPU time spent on atomic operations is significant. Consider using reduction operations where possible.
Creation
Metric Description
Creation time is CPU time that a runtime library spends on organizing parallel work.
Possible Issues
CPU time spent on parallel work arrangement can be a result of too fine-grain parallelism. Try parallelizing outer loops, rather than inner loops, to reduce the work arrangement overhead.
Other (Overhead)
Metric Description
This metric shows unclassified Overhead time spent in a threading runtime library.
Reduction
Metric Description
Reduction time is CPU time that a runtime library spends on loop or region reduction operations.
Possible Issues
A significant portion of CPU time is spent on doing reduction.
Scheduling
Metric Description
Scheduling time is CPU time that a runtime library spends on work assignment for threads. If the time is significant, consider using coarse-grain work chunking.
Possible Issues
Dynamic scheduling with small work chunks can cause increased overhead due to threads frequently returning to the scheduler for more work. Try increasing the chunk size to reduce this overhead.
Tasking
Metric Description
Tasking time is CPU time that a runtime library spends on allocating and completing tasks.
Split Stores
Metric Description
Throughout the memory hierarchy, data moves at cache line granularity - 64 bytes per line. Although this is much larger than many common data types, such as integer, float, or double, unaligned values of these or other types may span two cache lines. Recent Intel architectures have significantly improved the performance of such 'split stores' by introducing split registers to handle these cases. But split stores can still be problematic, especially if they consume split registers which could be servicing other split loads.
Possible Issues
A significant portion of cycles is spent handling split stores.
Tips
Consider aligning your data to the 64-byte cache line granularity.
Note that this metric value may be highlighted due to Port 4 issue.
Store Bound
Metric Description
This metric shows how often CPU was stalled on store operations. Even though memory store accesses do not typically stall out-of-order CPUs there are few cases where stores can lead to actual stalls.
Possible Issues
CPU was stalled on store operations for a significant fraction of cycles.
Tips
Consider False Sharing analysis as your next step.
Store Latency
Metric Description
This metric represents cycles fraction the CPU spent handling long-latency store misses (missing 2nd level cache).
Possible Issues
This metric represents a fraction of cycles the CPU spent handling long-latency store misses (missing the 2nd level cache). Consider avoiding/reducing unnecessary (or easily loadable/computable) memory store. Note that this metric value may be highlighted due to a Lock Latency issue.
Task Time
Metric Description
Total amount of time spent within a task.
Thread Concurrency
Thread Oversubscription
Metric Description
Thread Oversubscription indicates time spent in the code with the number of simultaneously working threads more than the number of available logical cores on the system.
Possible Issues
Significant amount of time application spent in thread oversubscription. This can negatively impact parallel performance because of thread preemption and context switch cost.
Total Iteration Count
Metric Description
Statistical estimation of the total loop iteration count. Values of this metric are not aggregated per call stack filter mode.
[uOps]
Metric Description
uOp, or micro-op, is a low-level hardware operation. The CPU Front-End is responsible for fetching the program code represented in architectural instructions and decoding them into one or more uOps.
VPU Utilization
Metric Description
This metric measures the fraction of micro-ops that performed packed vector operations of any vector length and any mask. VPU utilization metric can be used in conjunction with the compiler's vectorization report to assess VPU utilization and to understand the compiler's judgement about the code. Note that this metric does not account for loads and stores and does not take into consideration vector length as well as masking. Includes integer packed simd.
Possible Issues
This metric measures the fraction of micro-ops that performed packed vector operations of any vector length and any mask. VPU utilization metric can be in conjunction with the compiler's vectorization report to assess VPU utilization and to understand the compiler's judgement about the code. Note that this metric does not account for loads and stores and does not take into consideration vector length as well as masking. This metric includes integer packed SIMD.
Wait Count
Metric Description
Wait Count measures the number of times software threads wait due to APIs that block or cause synchronization.
Wait Rate
Metric Description
Average Wait time (in milliseconds) per synchronization context switch. Low metric value may signal an increased contention between threads and inefficient use of system API.
Possible Issues
The average Wait time is too low. This could be caused by small timeouts, high contention between threads, or excessive calls to system synchronization functions. Explore the call stack, the timeline, and the source code to identify what is causing low wait time per synchronization context switch.
Wait Time
Metric Description
Wait Time occurs when software threads are waiting due to APIs that block or cause synchronization. Wait Time is per-thread, therefore the total Wait Time can exceed the application Elapsed Time.