Get Started with Intel® VTune™ Profiler
Use Intel VTune Profiler to analyze local and remote target systems from Windows*, macOS*, and Linux* hosts. Improve application and system performance through these operations:
- Analyze algorithm choices.
- Find serial and parallel code bottlenecks.
- Understand where and how your application can benefit from available hardware resources.
- Speed up the execution of your application.
Download Intel VTune Profiler on your system through one of these ways:
- Download the Standalone version.
- Get Intel VTune Profiler as part of the Intel® oneAPI Base Toolkit.
See the VTune Profiler training page for videos, webinars, and more material to help you get started.
Documentation for versions of Intel® VTune™ Profiler prior to the 2021 release are available for download only. For a list of available documentation downloads by product version, see these pages:
Understand the Workflow
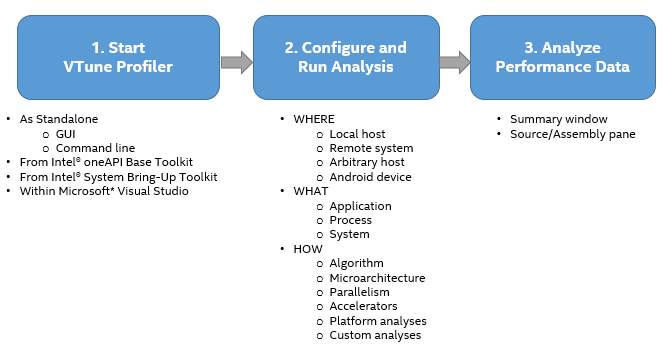
Use Intel VTune Profiler to profile an application and analyze results for performance improvements. The general workflow contains these steps:


