Get Started with Intel® VTune™ Profiler for Linux* OS
Before You Begin
Build your application with symbol information and in Release mode with all optimizations enabled. For detailed information on compiler settings, see the VTune Profiler online user guide.
You can also use the matrix sample application available in <install_directory>\sample\matrix. You can see sample results in <install-dir>\sample (matrix).
Set up the environment variables:
source <install-dir>/setvars.sh
By default, the <install-dir> is:
$HOME/intel/oneapi/ when installed with user permissions;
/opt/intel/oneapi/ when installed with root permissions.
Step 1: Start VTune Profiler
Start VTune Profiler through one of these ways:
Source |
Start VTune Profiler |
|---|---|
Standalone/IDE (GUI) |
|
Standalone (Command line) |
Run the vtune command. |
 in the Welcome screen.
 Step 2: Configure and Run Analysis
After creating a new project, the Configure Analysis window opens with these default values:
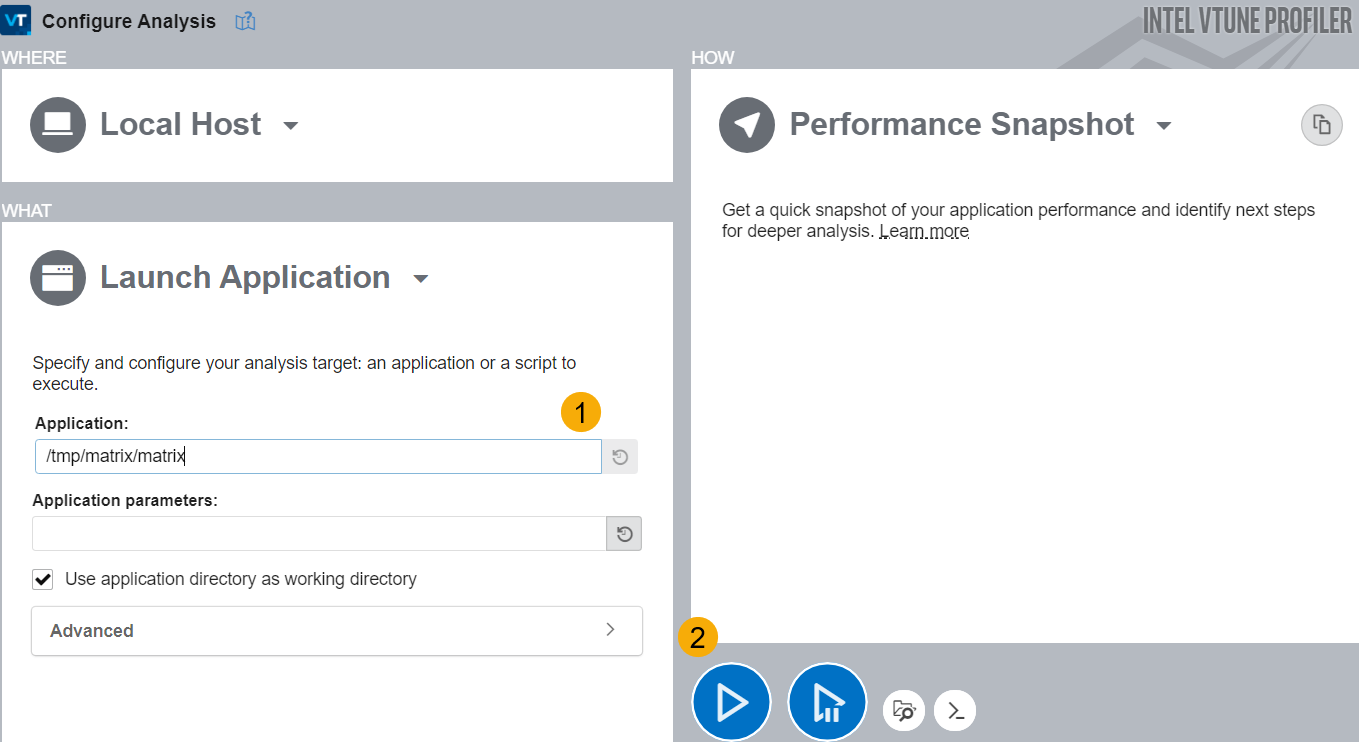
In the Launch Application section, browse to the location of your application.
Click the Start to run Performance Snapshot on your application. This analysis presents a general overview of issues affecting the performance of your application on the target system.
Step 3: View and Analyze Performance Data
When data collection completes, VTune Profiler displays analysis results in the Summary window. Here, you see a performance overview of your application.
The overview typically includes several metrics along with their descriptions.
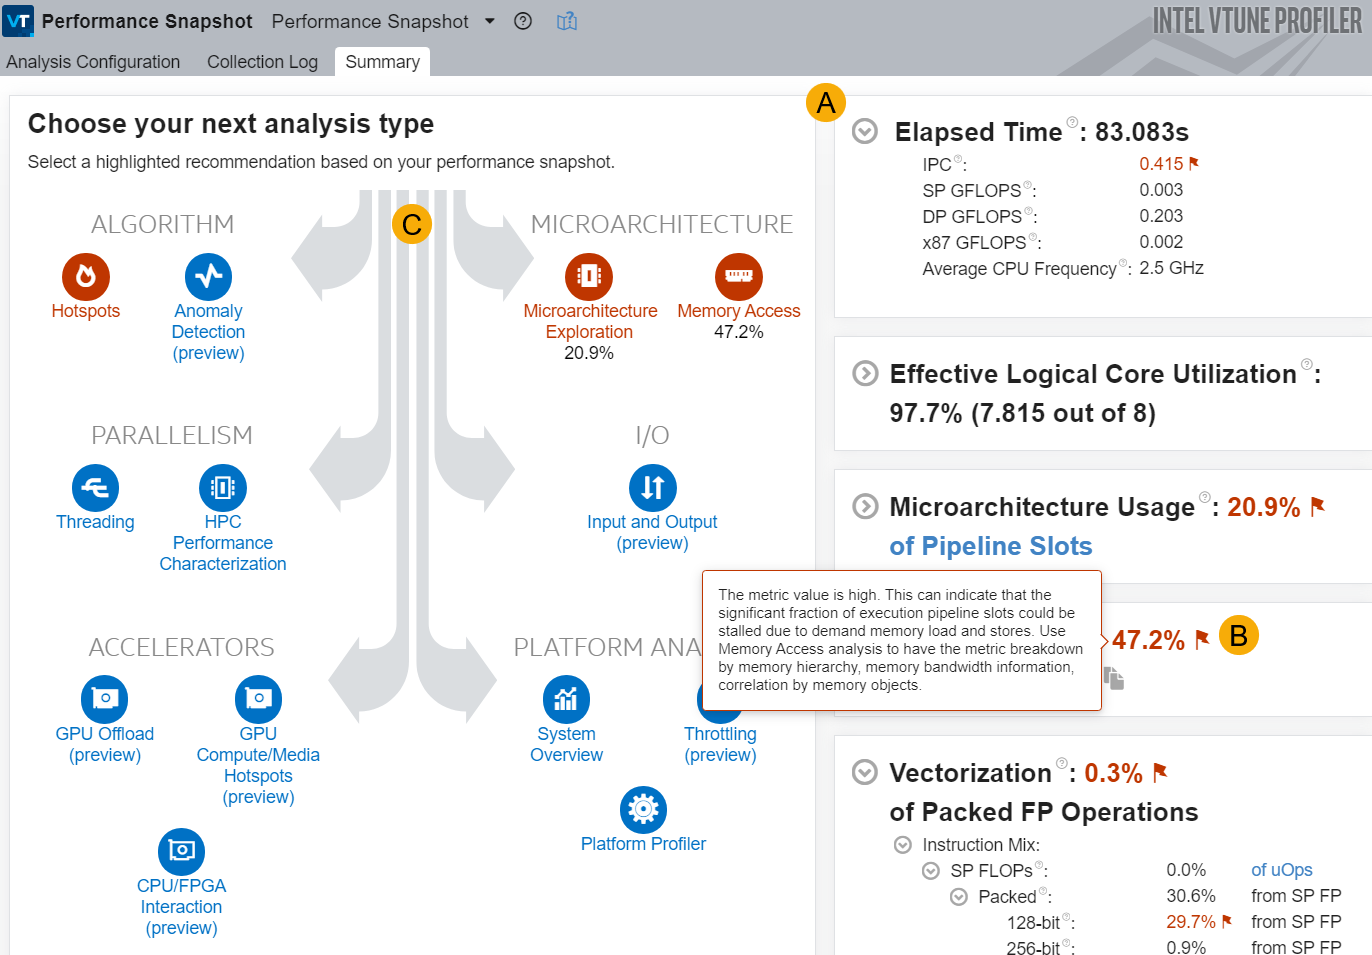
Expand each metric for detailed information about contributing factors. |
|
A flagged metric indicates a value outside acceptable/normal operating range. Use tool tips to understand how to improve a flagged metric. |
|
See guidance on other analyses you should consider running next. The Analysis Tree highlights these recommendations. |
Next Steps
Performance Snapshot is a good starting point to get an overall assessment of application performance with VTune Profiler. Next, check if your algorithm requires tuning.
Follow a tutorial to analyze common performance bottlenecks.
- Once your algorithm is well-tuned, run Performance Snapshot again to calibrate results and identify potential performance improvements in other areas.